The National Agricultural Statistics Service has supplanted their [May] subjective report which had forecast improvement for this year’s almond crop. This month, their objective estimate is even rosier.  Of note however is the number of nuts per tree down -7.2% but larger in size which would appear to recollect the 2010 harvest.  1 million bearing acres (!)

  • Per Acre: 2,250 lbs. (-1%)
  • Bearing Acres (Trees planted 2014 or earlier): 1,000,000 (+60,000 acres)
  • VS. Subjective estimate of 2.2 Billion lbs: +2.3%
  • VS. 2016 Receipts to-date of 2.134 Billion: +5.4%
  • Nut set per Tree: 5,714: (-7.2%)
  • Trees per Acre: 117 (up from 116)
  • Kernel Weight: 1.57 grams (+3.5%)
  • NASS found kernels to be wider, thicker, and longer than last year. The largest kernels since 2010.

We shall see if this outlook holds true for our orchard. Our ranch management is extremely reluctant to make yield predictions and comparisons so we rely on these global surveys for intel.  This report details the sample testing procedures and predicts an 80% confidence level. The activity was funded by the Almond Board of California. Our mileage may vary.

Hot fun

A July afternoon on anchor was a near experience in heat stress. Keep in mind that A/C is a shore powered luxury only available at the marina; on the water you take what you get. This outdoors lifestyle can be pleasant, even on hot days, if there is a breeze across the water but during this exposure wind was calm.  [Cod Harbor Tangier Island.]
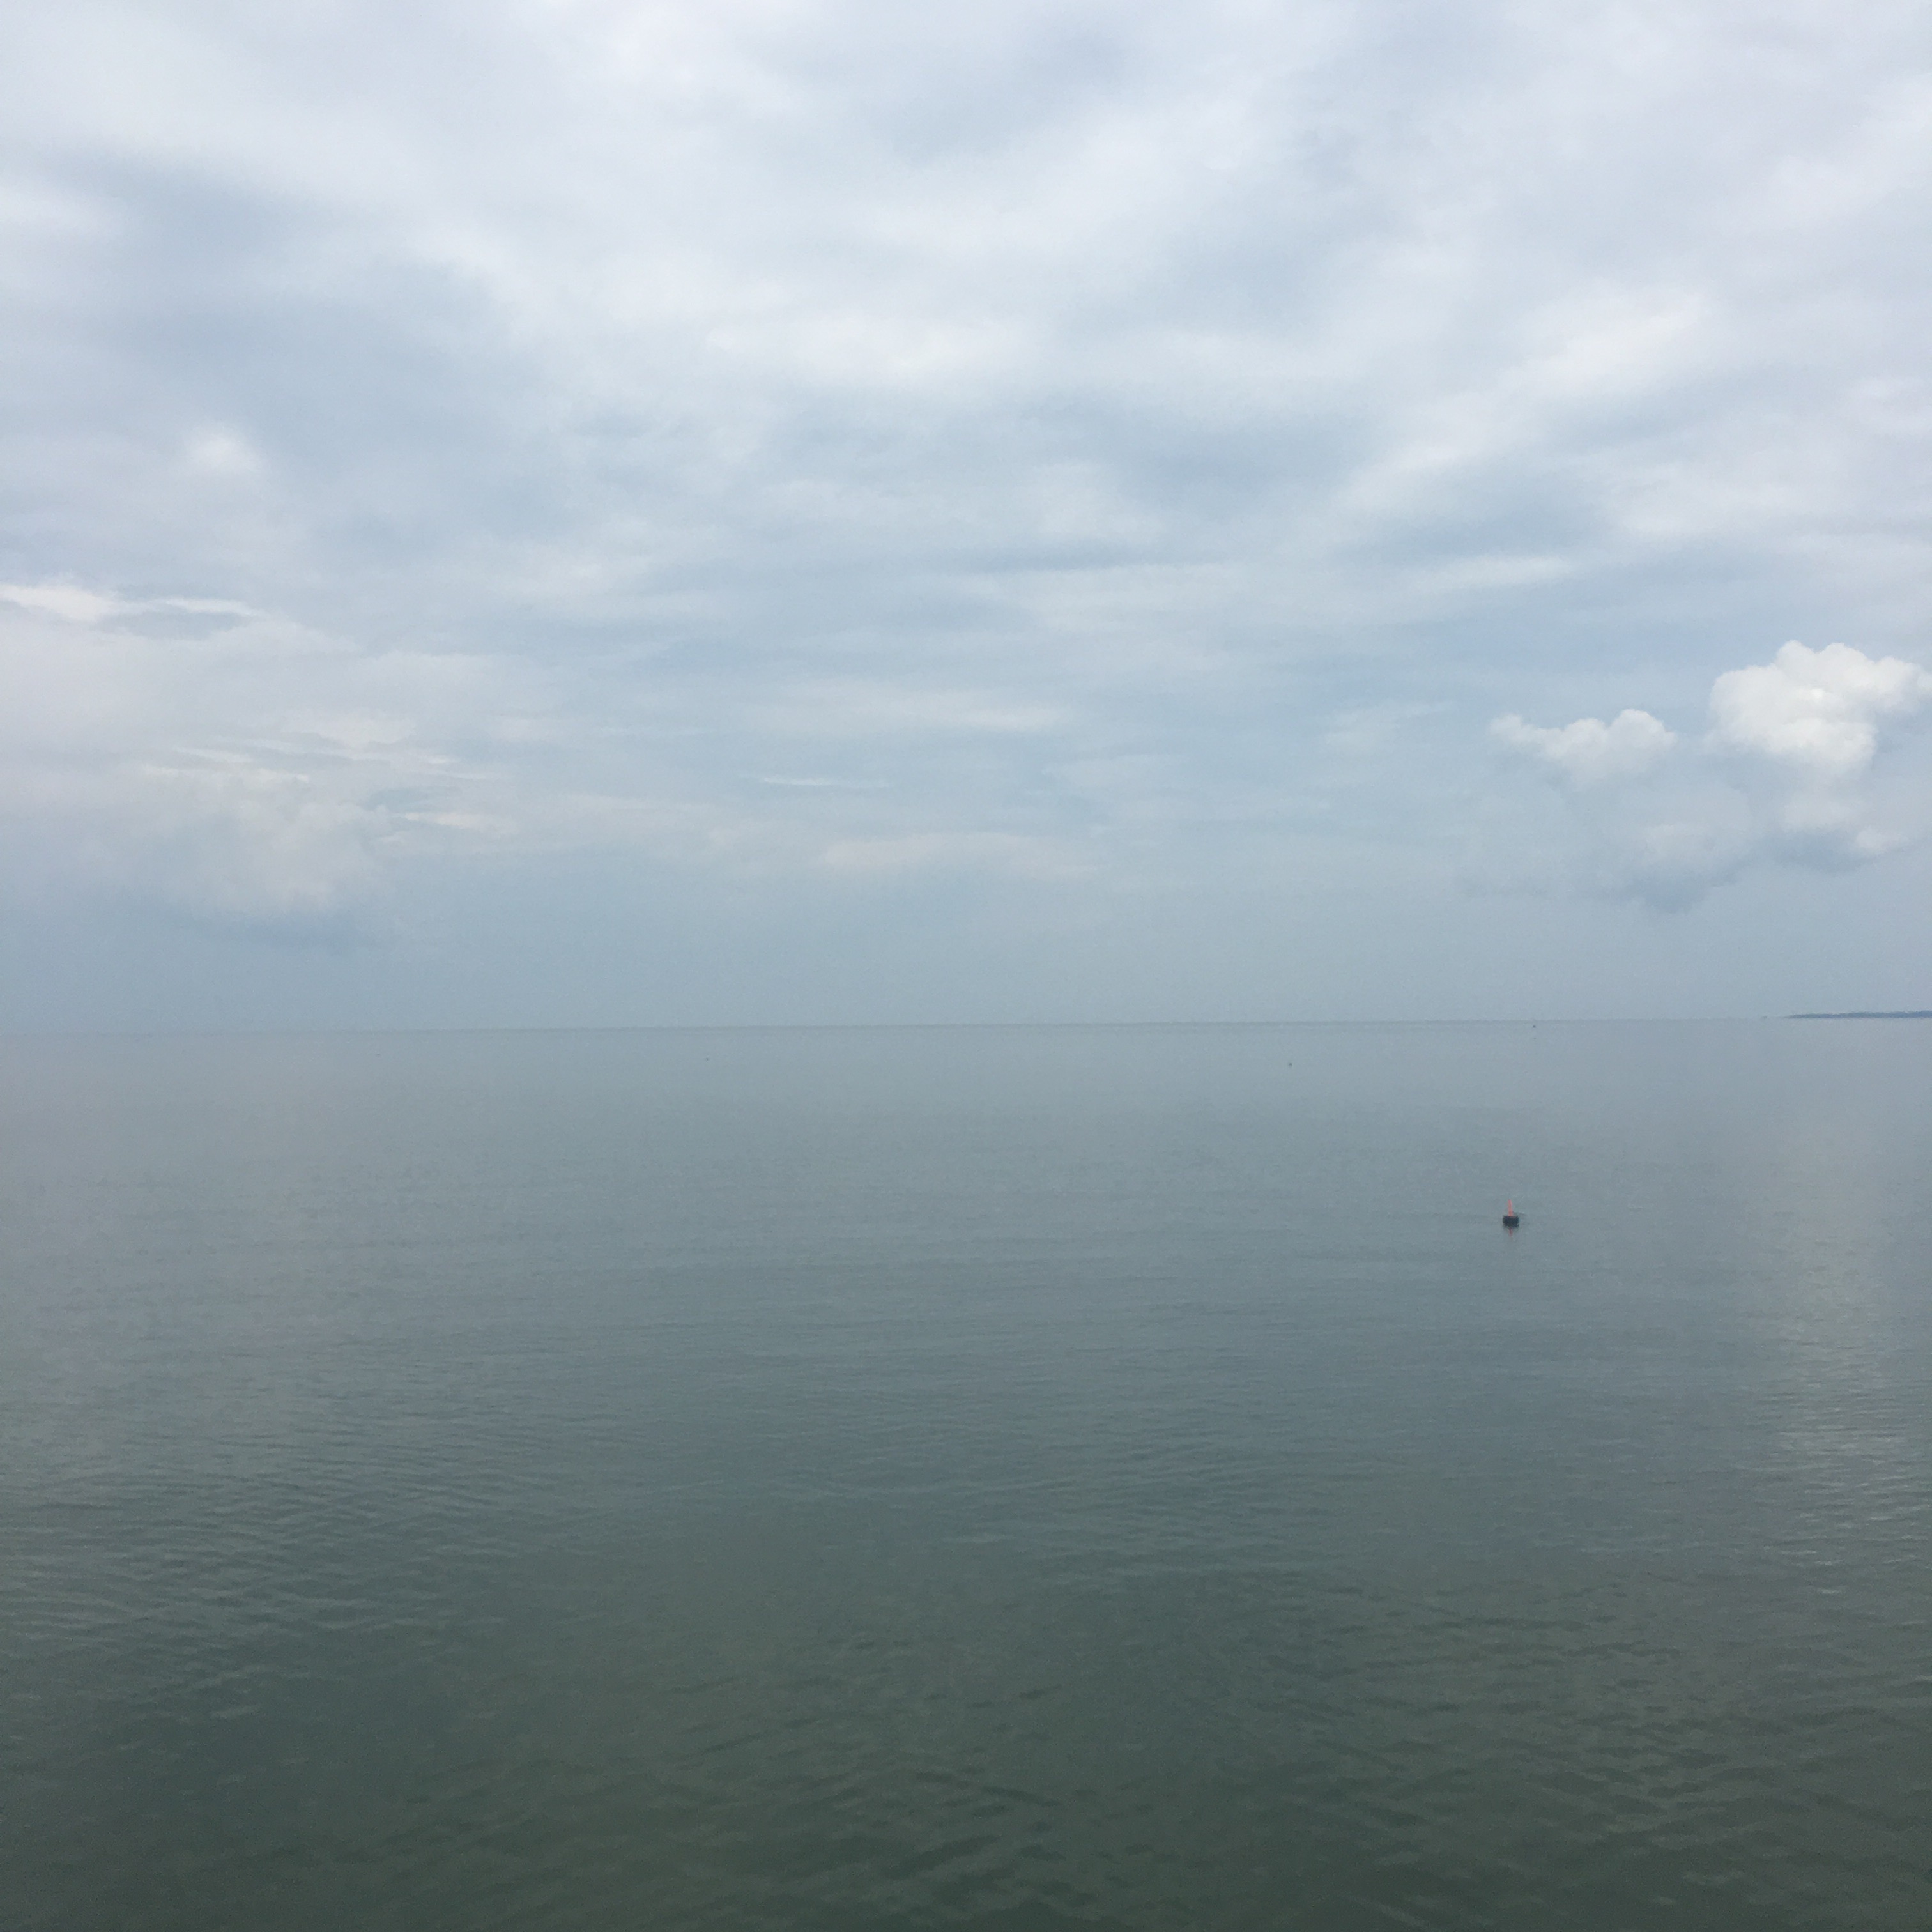
…and from the picture evidence observe the lone crab pot in a sea that is flat glass. The opaque sky seems to merge horizonless into haze and humidity. You can take a dip in the sea but with a water temp of 91 indicated it is not refreshing. The sun is high and shade areas on deck shrink The only escape is inside the cabin below.

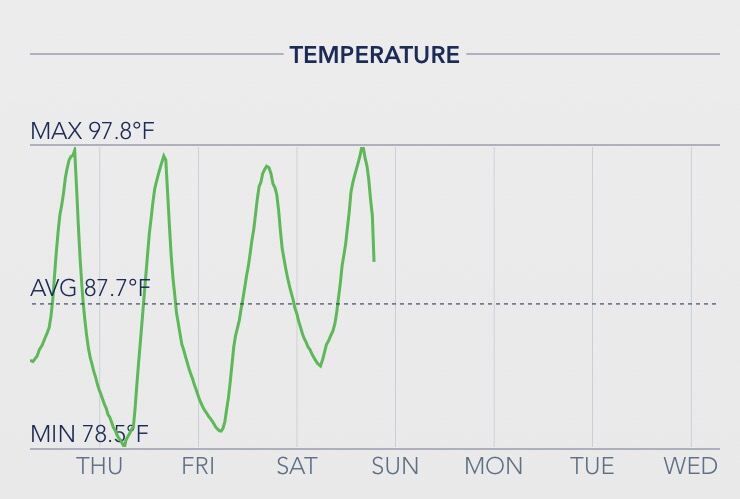
This is the representative cabin temperature log. Strip down and perspire. Try to hydrate. The water from onboard tankage is room temp. Hopefully there are some ice cubes left in the refrigerator box.

This was two days later on the Potomac. Same temperatures but with wind relief. Very nice. Even looks cooler doesn’t it?

Crab Pot

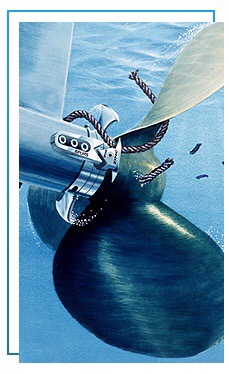
The bane of intracoastal cruisers these seasonal traps are everywhere. They are at times waywardly placed in the middle of navigable routes, which is where we connected with one or should I say connected to us. It was broad daylight (and you can imagine the extra challenge at nighttime) and was unseen but suspect when we heard and sensed a thump. A crap pot consists of sunken coup resting on the seabed, a stout retrieval line is floated to the surface by a marker buoy. Boaters must scan for these little floats but they are easily obscured by wavelets and glare. The float marker, styrofoam and plastic, can be harmlessly nudged aside by the hull but it’s the attached rope that is drawn to your spinning propeller that is the spoiler.

After the unexpected bump scan checked engine RPM and detected no changes in sounds or frequency but did note a loss in speed of about 1 knot. Aside from the thump this was the only clue. The only way to know for certain was to inspect the prop.

The prop is about 2′ below the surface and the only way to view is to stop and go over the side with mask and flippers; an unscheduled swim.

Most of these pesky hazards are in coves and harbors, anchorages are littered although in fairness they are distributed in linear string fashion every x number of feet. When you are anchoring they can be intimidating and always a challenge to stay clear to avoid mixing. If you happen to tangle, your prop is likely to be jammed into a non-functioning balled up mess. A saw tooth hand knife is necessary to laboriously cut the cord away. An enterprising idea is to install a set of propshaft blades that act to preemptively slice and dice.
I’m not convinced that this would actually work effectively at slow maneuvering RPMs in an anchorage or when using reverse.

During my impromptu inspection I discovered we had indeed been fouled and had been dragging an entire bundle of float, line, and trap for a mile. Our prop-wash had slammed the float through the propeller aperture snagging on the rudder without the line wrapping up in the prop. Phew! Lucky easy removal for us — but not for the Waterman. He will be wondering where his Crab Pot and Catch are…

Local Knowledge

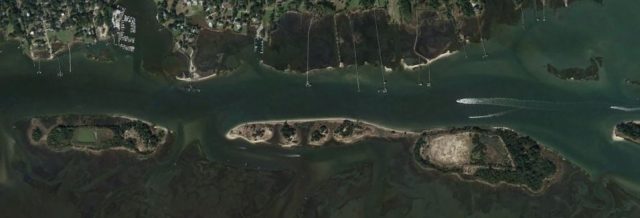
There was an obscure note on the chart that we overlooked. It needs bells and whistles because it caused some chagrin. Transiting local shoreline routes are challenging due to shallower water and obstructions. Our Washington DC back to NC trip just completed was roughly 450 miles of mostly Atlantic Intracoastal Waterway (ICW) so I guess we were fortunate that we escaped [most of] the unseen. The ICW is supposed to be maintained to a nominal depth of at least 12′ at low tide. Talmid requires 6′.  Satellite view of the Masonboro Sound on the New River – Cape Fear River
…and the NOAA chart presentation  – same locale

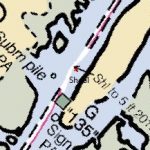
The dashed lines indicate the charted bounds of the ICW. Here is a closeup of the chart and observe the notice that we found pertinent which reads Shl to 5 ft 2016.

Translated: Shoal to 5 feet and dated last year. Ordinarily this would not be a problem area at high tide and I’d been through here twice before but at low water our deep keel found it — and we slid to an abrupt halt.

Worth mentioning is that the inland water is murky dark. Your eye can’t tell if it’s 2′ or 20′. There is a depth transducer onboard which gives us a digital indication of actual depth. We have a aural warning alert set to 10′ to get our attention should depth become a concern. In this instance it did give alert but the depth readout quickly went to 8′ and then just as fast I saw 4.6′ with no time to react. Stuck.

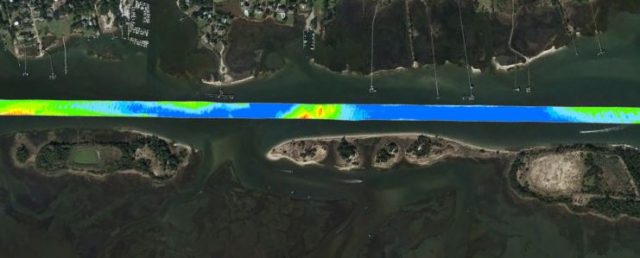
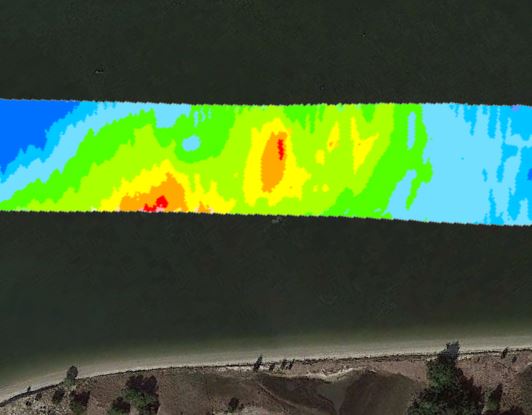
Pure sand bottom, so damage only to my ego. We were able to use reverse propeller at max RPM to extricate and not have to wait for the water to rise. After the fact, and back at my desk, I downloaded this Hydrographic Survey from the Army Corp of Engineers and one can clearly see the issue. The image below is the satellite view with the survey overlay.…and the relevant closeup section (just North of green lateral daymark #135)

Blue is 15+ deep water. Red = bad; and must be avoided. Ordinarily you keep the boat between the channel markers and you should be okay.  From the comfort of my armchair I can see that the preferred and ONLY route through favors the one side.

A published guide book might prove useful as no doubt there have been many gone before that made the goof. I can now say that I have first hand [local] knowledge.

Visual Comparison

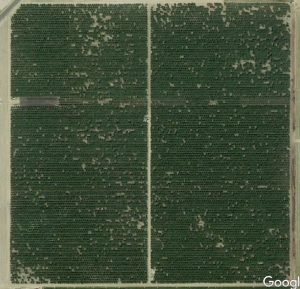
Recall our rough and tumble Spring weather just a few months back that resulted in significant tree damage and loss in the Almond Orchard. Excessive wind gusts took down many trees as witnessed at ground zero. A Google Maps Satellite image update (3/31/2017) depicts the losses from an aerial perspective. The first image, using Google Earth’s Time Machine feature, shows both West and East fields and dates from March of 2015

The lower image is the more recent

Knowing the number of tree rows and tree spacing we calculate a maximum possible number of trees at 16,995. Of course there will always be gaps because of inefficiencies. In 2015 we estimated 16,337. As 171 of those underlie the PG&E high tension wires and have been severely topped. We can figure 16,166 Healthy, mature, producing trees in 2015.

One could use the Google Maps Mapmaker feature to drop a pin at the newly visible missing tree map locations to get a count. That is tedious work. Instead we will rely on the Almond Harvest Machine to give us a value. It employs a digital counter that increments each time it moves from one tree to the next. Harvest begins next month and we will compare last year’s with this year’s.

Big Data

We farmers look for ways to maintain productivity. Aerial study by camera drone, soil moisture sensors and weather from satellites are tools for data focused farming. In a recent post we discussed irrigation water testing. Last month almond tree leaf samples were collected and the leaf tissue analyzed and our West Block and East Block results are in. For almond, leaf analysis is more useful in diagnosing mineral deficiencies and toxicities than is soil analysis. This is because soil analysis does not indicate whether plants are able to uptake the nutrients. The leaf tells us about [nitrogen] nutrient levels which is crucial for plant health and yield. (‘you are what you eat‘)

D & D Agricultural Laboratory performs the service for us. It would be interesting to be on site to witness the leaf collection method. For example, do they sample the 4th tree in every 4th row? Should you look at strong trees or weak ones? From which part of the tree to they take the leaf and why? answer

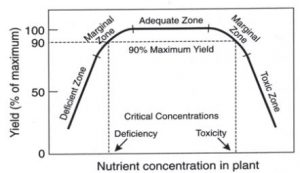
In the laboratory, they wash sample leaves in a weak detergent mixture, rinse them in distilled water and dry them at 65 degrees C. The leaves are then ground and a subsample analyzed to determine the content of the requested elements. The macronutrients N, P, K, Ca, Mg and S are usually expressed as a percentage and the micronutrients in part per million (ppm). These results are judged against known standards. For each nutrient, there is a correlation between its concentration in the plant and the yield of the plant.
The curve below describes this correlation. This curve is referred to as a “yield response curve”.  [ reference , reference2 ]

Interpretation is provided graphically and comparatively over previous year efforts by our lab. Tissue testing does little to explain the reason for the nutritional disorder. It is only an alert and can help to identify or explain visual cues.

So, how are we doing? Sampling is best done in July but in this early peek; things look good. Someday technology may allow growers to identify what an orchard needs and provide remedy on a tree by tree basis. That would truly be Big Data.

measure electrical energy and compare

It would be nice to know more about the descriptors of electricity. There are many sources of explanation. What are volts (pressure), amps (flow rate), watts (volumetric measure). Wondering why your iPad charges so slowly on an iPhone charger (1.0 amps) or horrors USB (.5 A) vs the larger iPad power adapter (2.1 A)? There you have it. Amps (A).  Its a given that your house is wired for a nominal 115 v and you car is 12 v. These types of numerical values for volts, amps, and watts in various application are furnished. If one of these three is unknown we can derive it from the other two. It may not be necessary to understand a precise definition but only to realize that they are used to describe the work of energy.  Continue onward.

In general, energy (E) is equivalent to power (P) multiplied by time (t). To determine E in watt-hours (Wh), P must be expressed in watts and t must be expressed in hours. Suppose a 60-W bulb burns for 3 h. Then P = 60 and t = 3, so the energy E in Wh is:

P * t = E using the example values for the variables 60 * 3 = 180 Wh

If P and t are not specified in watts and hours respectively, then they must be converted to those units before determining E in watt-hours. Larger values of P, upwards of 1,000 Wh would be expressed as kilowatt-hour (kWh). i.e. 1,000 Wh is the same as 1 kWh where k signifies 1,000. Fewer zeros that way.

One might be tempted to say 180 watts was the energy consumed but this would be inadequate as it leaves out the time factor. Using the full equation allows you to calculate unit(s) of energy. Take a look at your utility billing and you will see that burning your 60 W bulb for 3 hours resulted in a balance due of $0.0216 Your utility company doesn’t need to know that it was a 60 W light bulb or care that it was two 30 W bulbs or … They just need to know that it was 180 Wh.

How did we get P expressed in Watts in the first place? The light bulb example was straightforward as its P value was printed on the bulb. In some instances a device might have its P listed instead as amps. If we know this amperage value and we also know the value of volts then we can get to watts. Power (P) expressed in watts is equivalent to volts (v) multiplied by amps (A). Suppose a small motor is rated at 5 amps when connected to a 12 volt battery. Then A = 5 and v = 12, so P in watts is:

v * A = P using the example values for the vatiables 12 x 5 = 60 watts

Knowing at least two of the variables means that we can derive the unknown variable. In the above instance we knew v and A. What if we know P expressed in watts and we know v? Yes, we can figure for A:

P / v = A using the example values for the variables  60 / 12 = 5 amps

We’ve discussed E used by light bulb or motor consumers but what about stored energy — like in a battery? We would like to know the storage capacity of a battery. Knowing the available energy, and rate of energy consumption we can solve for t. In real words, if we run that light bulb all night we can calculate how much energy was used or how much will still be available or how much energy we must restore to the battery so that it can be used again the next night.

Battery energy (E) is equivalent to current draw expressed in amps(A) multiplied by time (t). The product is amp-hours (Ah). Then if A = 15 and t = 20 the energy (E) in amp-hours (Ah) is:

A * t = E using the example values 15 * 20 = 300 Ah

This battery supplied 15 A to a consumer for over a period of 20 hours during which 300 Ah was consumed. A typical deep-cycle battery will have a capacity rating expressed in Ah as its performance specification. A battery with E of 300 Ah would be fully discharge (deplete) in the above scenario.

Let’s convert the battery E expressed in Ah to power (P). Recall that volts x amps = P. So if we have a 12 v battery that can flow 300 Ah current we get P in watt-hours:

v * Ah = P using the example values for the variables 12 * 300 = 3.6 kWh

Great. So we have to convert the battery to kWh or convert the consumers to Ah. Let’s stick with the industry standard of capacity measure for batteries — amp-hours. Here’s a spreadsheet that shows a tabulation of various appliance items measured by amp-hours on S/V Talmid :

Sumtotal 1 day [underway] usage [from the Ah columns] requirement for this sailboat is 235 Ah. The battery bank capacity is 300 Ah. From this energy audit we could determine if our battery storage capacity was adequate or inadequate. Also some arithmetic will give an idea of how often, and for how long it will take to recharge the storage battery.

Charging Interval
= (battery bank (Ah) * allowable drawdown (30%) / daily requirement (Ah)) * 24hrs
= (300 * 30% / 161) * 24 = 13 hours

The audit tabulation reveals that sailing all night requires 161 amp-hours. The available energy is 300 amp-hours. Based on those givens the Charging Interval equation shows that after 13 hours we need to replenish the available energy.

Charging Period
= (battery bank (Ah) x allowable drawdown (50%) / alternator output(A) – hourly draw down (Ah)) + charging loss and thus: (300 * 30%)  / (100 – 13.4) * 120% = 1.3 hours

Assuming that the battery is now discharged to 30% the Charging Period equation informs that we need to run the engine with alternator for 1.3 hours.

formula explanation notes:

  • allowable draw down – typically to maximize battery health we don’t fully drain it to 0. Using only 25% of it before a recharge would be ideal. 50% is accepted as a maximum and counts as a cycle. Due to the nature of the material elements and effects of chemistry within  the battery, its life span has a finite number of cycles of perhaps 300 to 600.
  • daily requirement – is the sum of all the operative appliances based on how many hours they were switched on and their consumptive rate.
  • alternator output – 100 A used in the example may be typical but other installations will vary depending on budget or resource.
  • hourly draw down –  is energy point in time that continues to be used by appliances as you are re-charging. It is a deduction from the charging source which now has the double duty of feeding the consumers and the depleted battery.
  • charging loss – an arbitrary value, in this case 20%, which reflects real world inefficiencies. e.g. energy inadvertently converted to heat while converting AC to DC

We could play with the numbers — work the battery a little harder by discharging to 50%. This would allow us to enjoy 22 hours of peaceful serene sailing before firing up the noisy engine to recharge. On the other hand, doing so would require a more lengthy 2 hour recharge because we used more.

Takeaway: Volts times Amps equals Watts. This is all that you need to memorize from this post. Now you can determine the energy needs/cost of a hair dryer. Determine if your lantern will make it through the weekend campout.  A fun exercise might be to figure offsetting the energy consumption with Solar and or Wind. How many solar panels might be needed to relegate our engine generator (or utility company) to a backup role. Energy independence! and the subject of a future post.
Blue Diamond Growers Crop Progress Update Report for April

Several storm events during the period dropped significant amounts of rainfall over the orchards, with precipitation totals for the month ranging from  ½ to 1 inch from Fresno County south. Growers also endured several windy days that knocked nuts from the trees, broke branches and blew over a few trees.

Observers are reporting that the 2017 crop is developing well. Nuts are now fully sized, with the most advanced examples of the Nonpareil now beginning to show the first signs of solidification. Trees in all areas of the state have been shedding unfertilized nuts and those that they are unable to carry to maturity. However, this normal process has been a bit aggravated by the winds experienced during the month. Many have reported lush tree growth this year as the orchards take advantage of the mild temperatures. However, growers throughout the Central Valley have reported that the extended period of saturated soils during the winter and spring has resulted in weakened and dying trees. The repeated heavy rains experienced this year have promoted phytophthora root rot infections in many areas. As temperatures rise and water requirements increase, the dying roots of the infected trees are unable to draw water from the soil, resulting in weakened or dead trees. The continuing rain has inspired growers in the Sacramento and northern San Joaquin Valley’s to begin treatments to prevent Scab and Rust. These fungal infections can defoliate trees later in the season. However, the only effective method of control is through preventative treatments made prior to the appearance of the disease.

Sailboat Race

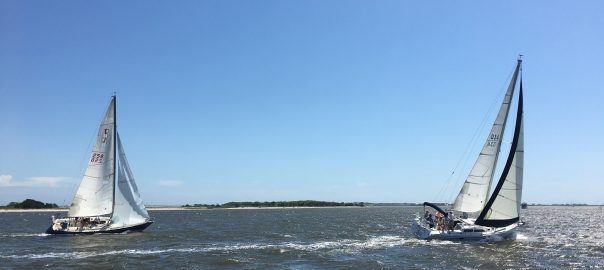
As a guest of the Cape Fear Yacht Club, I sailed in the first season PHRF 1, races 1 and 2. Crewing on a Catalina 22 it was a blast from the past. Defining the past; that would have been the Mile High Regatta in 1979 on a Hobie 16 (Fleet 62). It brought back many memories of the excitement and challenges although I’m not quite as nimble these days and my recall of racing rules a bit rusty.

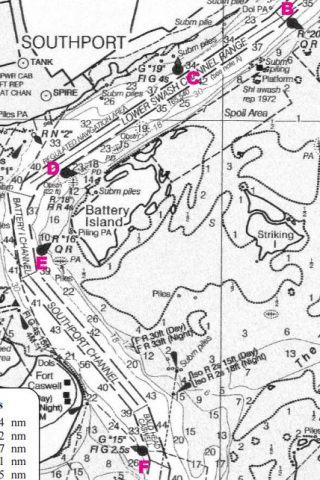
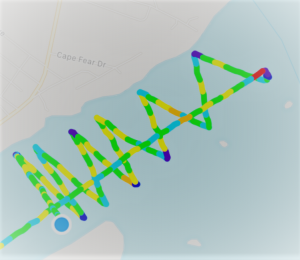
Today’s venue was the Cape Fear River very near to its entrance to the Atlantic Ocean. Tidal current was a definite consideration as I shall explain.  The course start line was between race mark “D” and the  committee boat. We crossed that line into the teeth of 10 gusting 15 knot SW breeze. The route cleared race mark “E” and continued on to pass by Fort Caswell to round mark “F” to starboard. There was a barge under tow in the Southport Channel but timing was such that our starboard tack allowed us to cross ahead and maintain safe buffer without interference. The next mark to round was “B” so back to toward “E” on a port tack  before reaching to pass “D”, followed by a wing on wing run downwind along the Lower Swash Channel Range. We held our own here and moved right along even though carrying a reef in the main and only a 90% jib. After rounding “B” it was a hard slog to the finish line beating down channel. The previously mentioned current was against us and this is where we blundered. Forecast Flood was to peak at 3 knots by mid afternoon. You can see from the trace the effect that it had. The close hauled legs at the “B” mark end shows adequate course made good. As time wore on observe that the zigzag legs compress with very little gains. (the center line down the middle was the downwind leg straight from “D” to “B”)

I saw the trace of our closest competitor after the fact and analyzed that he used a different strategy. After the first 2 long tacks to mitigate the effects of current he avoided the Northern side basically by staying south of that downwind track that we did; short tacking all the way.

Presumably the current was less when close to Battery Island and strongest between the Southport shore and the deep water in the channel of our downwind track. Smart competitor and now we know better.