Almond Crop Estimate

…and Contest! Woah boy. The Panoche Creek Packing publishes a newsletter titled: In A Nutshell; subtitled: Predictions and Trends for the California Almond Market. Panoche Creek markets our almond crop so it’s their dutyto keep tabs on industry trends regards to sales pricing and volume. The two are linked of course but the volume aspect is of particular interest to them because — job security!

So every year they host a just for fun event where their Grower Customers (like we) are invited to submit a value number that predicts the future. The results are published and a winner announced.

2017 Crop Estimate Contest
For our 2017 crop Estimate contest the prize will be $ 1,000. This year’s rules follow: The closest guess to the receipts of the 2017 crop, as shown on the March 2018 position report published by the Almond Board of California, will be the winner. The winner wilt be rewarded with a $1,000 cash prize. One entry per farm organization… etc. etc. 

I am not one to participate in lotteries, raffles, and drawings and less so in a public (real names) pronouncement of a guess. The aforementioned results are tabulated and if your submission happens to land too far outside the crowd median one might appear, ahem — uninformed. Embarrassing.

I did establish some Cred when I actually WON! the prize a few years back. Now I’m wondering how I can repeat that performance and live up to the fame. If this year’s guesstimate is way off the mark this time then I will have been a won-hit-wonder and everyone will know.

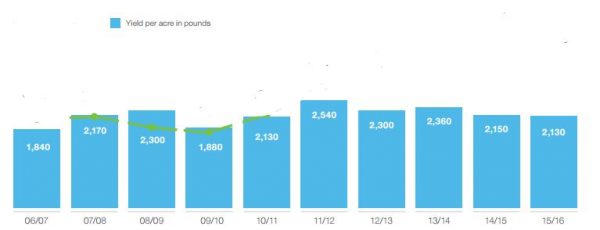
How does one derive a good number? Well “Ed”, the last year’s winner, bet 2,126,896,000 pounds (against 2,131,006,583 actual).  That’s a lot of nuts. The figure that I picked in 2014 was 1,901,449,000. Since then statewide there have been existing orchards removed and new orchards established. There are sources that monitor bearing acreage. Next to know is the average yield per acre. Yield in pounds per acre X number of acres = that big number in billions.  The trick is to predict the variances be they inaccuracies in the acreage estimates or fluctuations in the yield due to weather, acts of god and mother nature.

Historical Yield per Acre in pounds
Historical Bearing Acreage

source ] California Almond Board

It can be a challenge to interpret objective measurement reports. There is science to this and I’m sure there are people who are paid full time salaries to inform market players. Maybe just add 10% to the last guess and call it done.

But wait. There’s more to it. There is a keyword in the contest fine print that says: receipts. We have to analyze too the marketing aspect. Almond Packing Marketers (such as Panoche Creek) don’t always sell an entire crop in the year period of harvest. The excess is called a Carryin and this can amount to millions of pounds. The receipts amount to the number of pounds marketed. Best have a look at last month’s Position Report and will try and decipher.  Evidently there is a 3% Loss of the inventory every year due to critters, decay, age; this explains the difference between production and the remainder carryin/carryout. The tabulation below shows the receipt variable.

Year Yield Acreage Production Receipts
2007 1,840 610,000 1,122,400,000
2008 2,170 640,000 1,388,800,000
2009 2,300 710,000 1,633,000,000 1,606,372,490
2010 1,880 750,000 1,410,000,000 1,395,051,752
2011 2,130 770,000 1,640,100,000 1,618,404,740
2012 2,540 800,000 2,032,000,000 2,012,824,704
2013 2,300 820,000 1,886,000,000 1,878,596,013
2014 2,360 850,000 2,006,000,000 2,003,500,548
2015 2,150 880,000 1,892,000,000 1,888,243,454
2016 2,130 890,000 1,895,700,000 2,131,006,583
2017 ? ?? ??? ????
In a nutshell (sorry) we have the production to estimate and then figure how much of that as well might be counted as losses and then how well will the market absorb any carryin.
  • Our pick for 2017 should be: ????
  • Our number in 2016 was 1,989,499,000
  • Our number in 2015 was 1,789,000,000
  • Our number in 2014 was 1,901,449,000
She’ll be comin’ round the corner

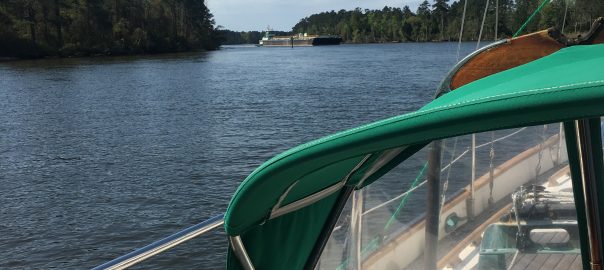
I’m riding the right hand side of the narrow channel when an ocean tug and potash barge suddenly appear from a blind bend.  I’m comfortably on the right side, in my lane so to speak, so I ready my videocam to try for a cool time-lapse passage. The tug is lashed to the barge stern and pushing. I get s still shot with the camera. We close at rate faster than you’d know and suddenly he’s upon me.  I should have anticipated (but now know) that he’d swing wide in his turn. This caught me off guard and quickly the filming idea was abandoned.

There was experience on the tugboats part. The skipper radically reduced speed, but there was momentum. I dead stopped. All this took a few clock is ticking seconds of analysis/interpretation but it became crystal to me that I was to get out of the way! I made a 90 degree turn to port and crossing his prow scurried on over to the other side of the channel. Safe.

Just barge on through! I reckon he anticipated my moves as he was quite patient; not even laying on his horn — which would have surely caused me to jump-out-of my sea boots. Wish I had the video though 😉

[map]

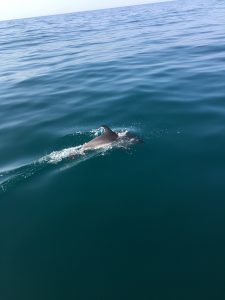
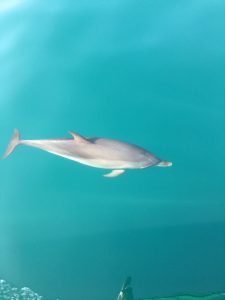
Dolphin

A frequent happening evidently but seeing in person never gets old. These creatures are free and fun loving. You can see them jumping waves on their way to greet. Riding the pressure wave off of the bow is sport for them. Graceful aren’t they?

…on location off of Bald Head Island NC

Look! What the…

Sometimes there is a surprise when the anchor comes up.  Usually you find that the bottom was sandy (clean or grassy) or muddy (unclean). If it’s rocks or coral, then you probably knew that already because holding would have been poor to nil.

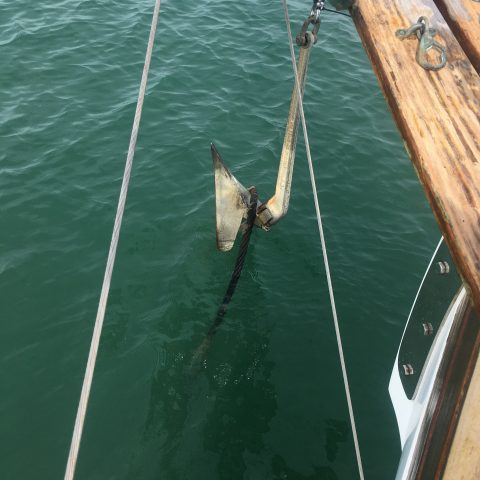
A recent overnight stay rest break took place off the Intracoastal Waterway (ICW) outside buoy marker 23. The anchorage has easy access but frequently shares parking with tugs and barges. For this stopover there was plenty of sea-room and I snuggled in.  Raising anchor the next morning seemed routine until the last bit and this is what I saw:

My plow anchor had dredged up what looked like cable and I was aghast thinking it was critical telecommunication infrastructure or electrical utility for the island adjacent. But my chart provided no notes of caution had that been a concern. Sometimes when an anchor fouls it remains planted to the seabed where you can’t see the cause; not without a swim and a free dive for inspection. I’m lucky that the anchor windlass on deck had the muscle power to lift the cable from the bottom of its 10′ depth.  No SCUBA needed.

A close look revealed this cable to be a crusty steel hawser that had gotten away  from a work vessel. Where a recreational boater might use a 1/2″ or less light size/weight rope for securing his craft, this one was industrial gauge; at least an inch or so in diameter and very heavy duty. In fact, due to the angle of the anchor plow, the beast was well caught up. I tried backing down to see if it would just flip off but I couldn’t shake it. I thought maybe a neighboring work crew that was busy getting a barge ready might have tools, skills, or desire to take claim. I decided to solve this one on my own.

If I had a do-over, I would have tied a length of rope to the cable and the bitter end to my bowsprit platform.  Simply lowering the anchor chain at that point would have freed my anchor. What I ended up doing was raising the anchor until the plow edge went horizontal. With a flat surface I figured I could just slide the cable off. But bare hands still couldn’t budge. I went aft to find my boat hook pole to gain leverage. With not too much heave-ho the cable slid aft toward the anchor tip. The distance to freedom wasn’t far but each inch required some grunt on my part. As the bulky cable was finessed off it immediately plunged back down to the dark depths. Unfortunately, and I realized in an instant too late what was to happen next and what the outcome would be, because — the boat hook was still hooked! The heavy cable was about to claim it and my arm too had I not made the correct choice and released my grip.

King Neptune has his cable back — and my boat hook as well.

It’s the Water

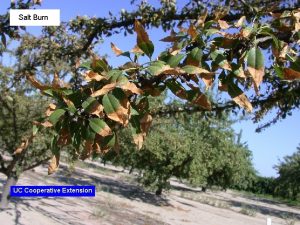
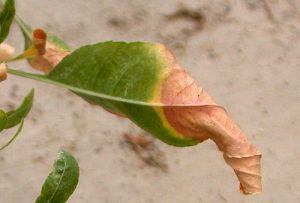
Irrigation water contains soluble (dissolved) mineral salts. Overtime, these salts can build-up in the plant root zone. Excess salinity creates osmotic stress. A plant must expend competitive energy to absorb water from a saline soil. In addition to total salt content we are concerned about specific salts such as sodium, chloride, and boron. For the most part, roots normally exclude between 95-99% of the dissolved mineral salts applied. The tree sucks up the water leaving the salt behind. At some point however, the concentration of salts exceeds the tree’s ability to exclude them. The salt is then picked up by the tree, moves to the leaves, and burn occurs. Leaf burn reduces photosynthesis.

Leaf Burn

… not to be confused with Leaf Scorch, a biological cause

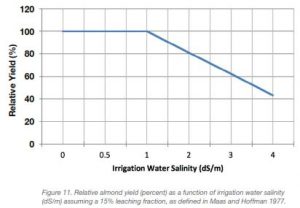
Water sources are not created equal. For example, our new Well #3 has sweeter water than our Well #2. We have this awareness because we test for water quality annually. The agricultural laboratory with which we contract, scientifically measures the salinity by electrical conductivity (EC) in units of decisiemens per meter (dS/m) Water salinity of up to 1.0 dS/m and average root zone soil salinity 1.5 dS/m is a-okay. [source]

The 2016 lab water analysis report:

  • Well #3 Soluble Salts @ 0.53 dS/m
  • Well #2 Soluble Salts @ 0.83 dS/m

But, specific salts (Sodium, Chloride, Boron) accordingly are well above optimum range.

There is relief! We cannot easily procure a better water source but we can dissipate the salts from the soil through leaching. Essentially, the soil can hold water moisture up to a point at which time, thanks to gravity, its ability to retain is overcome and water passes through** flushing the salts with it.

Our Sandy Loam soil type has a water holding capacity of .07 to 1.4 inches per foot of soil. Rainfall is nature’s way of cleansing (and it costs very little) but we must assist the leaching process with remedial applied irrigation.

How much is needed? For Well #3, that has irrigation water with electrical conductivity of 0.53 dS/m; the percentage of water that needs to pass beyond the root zone is 7% or 3.9 inches of water. This is in addition to Evapotranspiration* (what the trees ordinarily need to drink). The requirement for Well #2 is double at 14% and nearly 9 inches of extra water. So a takeaway is to favor Well #3. [source]

When? We like to leverage the leaching period with the rainy winter months when trees are dormant and soil fertilization (Nitrogen) has not been applied. This year we had abundant rainfall.  The CIMIS estimates 11.45 inches since the first of the year. Whoohoo!

*Evapotranspiration is the loss of water through soil surface evaporation and transpiration through openings in the leaves.

**assumes no barrier e.g. hardpan we rip the soil before planting

South Boundary Question

There’s a county road on our property line, called Dinuba Avenue, that allows access to our farm.  A Dairy Farm, the neighbor to our South, uses this road as well. Public access is restricted because there is a jointly owned locked iron gate spanning its entrance.

We use this road as an equipment turnout as our vineyard rows terminate at the road. It is necessary to have this space for truck and trailer staging during the grape harvest. The busy highway on the opposite end of the vineyard rows is unsafe and therefore not suitable.

Historically, the Dairy has maintained a shoulder on their side of the road. Recently they diverged from their usual business and contracted to have an orchard established. Their new tree rows are to run parallel to the road.  An outer tree row has been planted on the roadside edge.

Considering that their orchard trees will soon develop an expansive canopy possibly extending onto the roadway we are concerned that our access to it will be obstructed.

Overview Video:


Blue Diamond Growers Crop Progress Update Report for March

Observers are reporting that crop development increased dramatically in all regions under the influence of the warm conditions experienced during the first week of the period. As seen in the photos accompanying this report, nutlets have been differentiating in size, with the largest breaking free from their protective jackets. Leaf cover on the trees has also developed vary rapidly, allowing the trees to begin pulling nutrients and water from the soil. The trees have also begun the normal process of casting the smallest nutlets to the ground, while preserving the largest. Continue reading Almond Update

The Cost of Water

The PG&E Energy Statement comes every month and it is a major slice of our annual expenses. Dissecting the utility bill while solving for ‘X’ may provide some clarity.

Constants (known assumptions)

  • kWh == kilowatt hours – a measure of energy consumption
  • Well #3 produces 1,792 GPM at a consumption rate of 169 kW
  • Well #2  produces  780 GPM at a consumption rate of 77 kW
  • Booster has a consumption rate of 41 kW
  • Booster Pump must be run during operation of either well.
  • 325,851 gallons == 1 acre foot

Rates for Energy Charge (reference the PG&E document: Large Time of Use Agricultural Power – Schedule AG5B )
Summer
Peak:            $0.20775 12:00 noon to 6:00 p.m. Monday through Friday
Off-Peak:       $0.08974
Winter
Partial-Peak:  $0.10984 8:30 a.m. to 9:30 p.m. Monday through Friday
Off-Peak:       $0.08143

Calculations showing my arithmetic
1792 gpm * 60 min = 107,520 gal/hr so 325,851 / 107,520 = 3.03 hrs to produce 1 acre foot
780 gpm * 60 min =   46,800 gal/hr so 325,851 /  46,800 = 6.962 hrs to produce 1 acre foot

Billing breakdown explanation
There are primarily three types of charges on an electric bill: fixed charges, energy charges and demand charges.

  • Fixed Charges are usually small fees that do not change from month to month. ~$40/month
  • Energy Charges is based on the amount of electricity in kilowatt-hours (kWh) consumed over the entire billing cycle and vary depending on time of use.
  • The amount of electricity being consumed at any single moment is known as Demand (kilowatts).  Demand Charge is a calculation using the maximum energy consumption flow rate seen during the billing period.  For each 15-minute period in a billing cycle, the average demand is calculated. Typically, a motor startup will result in this peak flow rate value but the average over the 15 time interval helps to mitigate somewhat. The utility billing amount for Max Demand is $5.95 and Well #3 has a typical Max Demand of 168 kWh so the product of the 2 would be $1,000.00

Billing summary based upon actual averages
All of this boils down to real world average billed costs (including meter charges, demand charges, etc.) of:
$0.13 kWh  for Well #2
$0.20 kWh for Well #3
$0.12 kWh for the Booster Pump

Usage sample (July / August )
Well #3 running for 3.03 hours produces 1 acre foot of water with an energy usage of 512 KWh with the Booster Pump using 125 KWH for a total of 637 KWh. Cost per acre foot == $117.40 ((512 x .20) + (125 x .12))

Well #2 running for 6.962 hours produces 1 acre foot of water with an energy usage of  536 KWh with the Booster Pump (req’d) using 285 KWH for a total of 821 KWh. Cost per acre foot == $205.25 (821 x .25)

 Takeaway after solving for X

  1. Turning on a well when irrigation is not planned as if only to fill a truck water tank or perform a well test would cost a grand just to throw the switch! See the PG&E service period 11/17/2015 to 12/15/2015 and also PG&E service period 1/15/2016 to 2/16/2016 for Well #2
  2. Well #3 is the more efficient. This Well uses more energy as it is throwing more water (working harder) but it takes less time to get to the finish line.
  3. Off Peak usage is much cheaper. During some summer months the Well(s) must run ’round the clock so the ability to take advantage of rate incentives is limited.

Apologies if you found that topic to be DRY (and sorry for the pun), but water is a critical ingredient for we farmers. I promise future articles on this important resource.

Pollination Fini

Blue Diamond Growers update report:

Bloom has concluded for most of the state. Butte and Padre orchards have less than 10% viable flowers remaining throughout the state. Bees are beginning foraging elsewhere for pollen. Leaves are emerging in all varieties and nutlets are starting to break through their jackets in early blooming varieties. 
Continue reading Pollination Fini