Category Archives: Horticulture

Pass the Salt

Excessive sodium and chloride levels continue to dog the orchard farming operation. We rely on the fall/winter rain season to cleanse the soil through a natural leeching process. Flooding the orchard floor helps to flush harmful accumulations beyond tree root zone. When the rains are deficient due to drought then this process does not happen. The trees absorb the chemicals and tree health and productivity is strained.

Irrigation water can be used to augment to a degree, but in our situation the aquifer is laced with and carries sodium to the field not to mention that pumping is costly and about to become regulated. Interestingly, a water chemical analysis reveals that Well water quality varies. Our mid-field pump (#2) draws water with a sodium concentration of 5.1 mEq/L (milliequivalents per liter) vs. our newest Well (#3) measured at 7.1 These Wells are only 1/4 miles apart so the variance is confounding.

For operational purposes Well 2 is typically 
used to irrigate the wine grapes while Well 3 
is used to provide water for the almond trees. 
Therefore the orchard takes the hit.

The following graphs display tabulated laboratory leaf tissue results from over time. The “Spring” chart captures data from April and the “Summer” — several months hence when almond nuts are well along in development. During this span the trees have been thirsting down the irrigation water and as you observe the sodium concentration as a relative percentage has gone way up. Salts and chlorides are being stored in the plant and can’t be disposed of until leaf drop at the end of the growth season. High concentrations have been the norm but this year [2020] we are seeing an excessive manifestation.

For Almonds the green tinted band is the optimal, yellow is high, and red excessive!
The bars on this chart wouldn’t fit on the other chart. The Y axis scale had to be increased

Witness the data confirms as boots in the field confirm toxicity with attendant leaf burn. By the end of season many of our poor trees in the orchard will appear to be dead but miraculously, will renew themselves for the next year. The trees are resilient fortunately; if only we could reduce the stress…

Ranch Visit

I visited the property on this October day for a general inspection. Everything was in order; no problems to report. A description of current events follows.

Orchard V-Float

The orchard is in good shape with the trees looking a bit haggard, as they do post harvest. We usually experience leaf drop compared to younger trees which retain longer. On the trees that were still holding leaves there was little salt burn as evidenced during previous drought years. The orchard floor had been Floated recently giving a great showcase appearance.

smooth and level
V-Float implement

Tree Removal

The former PG&E cable-pull site has been maxed out and burning under the high tension wires is probably no longer is an option. The South road has been a staging area for trees to be cut up for a couple of years now. The wood is ground and the chips are being uniformly spread on the driveable portion of the South road. I noted that the North orchard road is being used for some overflow of branches; possibly only because it is localized to the removal area and more efficient.

An old tree that gave out.
These are replants in the East Block that are well established and will be producing in a couple of years.

Post Harvest Irrigation

Micro-sprinkler on a spike

Some micro-sprinklers have been tapped into the drip line. These increase the flow of water to the replants; giving them a fighting chance to make it. It is a tough beginning. They are competing with their mature neighbors and there is not as much sunlight exposure sometimes but plenty of drying heat. Notice that there are some weeds growing along the berm. Tractor implements can do little there.

Well #3 flow meter

The drip system had been running a 24 hour set at the time of my inspection visit. Well #3 was supplying water at 2,150 GPM according to its flow meter. The Vineyard received water the previous week. The trees and vines require water so that they will have stored the necessary energy reserves for the start of the next growing season.

The irrigator despite the language barrier showed me how to adjust the drip booster VFD. In a follow up post we will do a deep dive on this topic.

Vineyard – Till and Pack

The vineyard is looking very fine, post harvest with very clean removal of the grape clusters noted this year. Only randomly scattered grapes (now raisins) remain still attached. They were quite sweet although having seeds in them, a bit crunchy. There was one metal end of row post that was a harvest casualty. Looks like the grape picker may have clipped it… I’m sure it can be reset.

Before
After

Weed control was in progress with a tractor pulled disc doing battle against Bermuda grass between the vine rows.

Dairy neighbor’s new orchard

Interesting to observe in our Till and Pack operation how close that the trailing roller comes to the neighbors new trees. Granted, the rig that we are using is a large tractor pulling a long train but our driver appears to be using every inch of available real estate to make his 180 degree turn. We were wise to insist that the neighbor farmer make the adjustments when he planted.

Lastly, a look at a backlit vine and see that the trunk is showing growth maturity. It wasn’t that long ago that we were planting root stock it seems.

A permanent cordon – spur trained / cane pruned..

Chilling Out

It’s hard to believe but here we are back to the beginning; wash rinse repeat, it’s springtime bloom already. The growing cycle renews. Winter sanitation was completed, and soil moisture adjusted (rainfall was rather weak this go round). The season is off to a start with the early arrival of warm daytime temperatures. This brings on the flowers for pollination and luckily the bee hives have been on site for the last two weeks to take full advantage of the warm afternoons.

Nights can still be cold at this juncture and our Monday and Tuesday forecast frost/freeze is a potential pitfall:

Advection frosts can be severe and usually result in more damage. They occur with wind present as cold air comes from areas outside the orchard. Not happening.

Next weeks scenario is for mild, radiation frost that occurs on still, clear nights, often with the development of a strong inversion.

At pink bud, flowers are more resistant to cold compared to full bloom, which is more resistant than at petal fall or with small nuts. The following table is a guideline.


We are not completely at the mercy of Mother Nature:

Groundcover condition affects orchard minimums with any cover taller than 4 inches in height generally being colder. Soil heat storage is reduced because sunlight is reflected and water is evaporated. Keeping groundcovers cut short to 2 inches or less during frost season allows sunlight to reach the soil surface, and increases soil heat storage resulting in a warmer orchard through the night. Bare soil with soil moisture near field [moisture] capacity (about 2 days after wetting) is warmest because it transfers and stores heat best. A light irrigation to moisten dry soil a day or two before a frost will help obtain the greatest heat . Running the system during a frost may provide slight benefits due to radiation heating from the wetted area beneath the trees. Flood irrigation for frost protection works in a similar fashion but due to larger water volumes it will provide more protection as long as ice doesn’t form on the water’s surface. In our experiments with micro-sprinklers, applying 15, 25, and 40 gallons per minute per acre resulted in little difference in observed air temperatures. However, exposed temperatures were 1 to 2 degrees  warmer at the higher water rates. Exposed temperature is what the buds themselves experience. — via UCCE farm advisor and UC Davis biometeorologist http://bluediamondgrowers.com/grower-news/frost-protection/

Our current status is firm, moist earth with no ground cover. We are presently between pink bud and full bloom. A technical malfunction with the drip irrigation system means that a precautionary irrigation will not be possible.

Fortunately, as the chart presentation depicts, we will be alright; it is the early nut stage that is most at risk.

Enemy in the Vineyard

As a percentage of expense (22%), we spend considerable effort in controlling insect pests and weeds on our farm. Invoice statements from a supplier arrive with esoteric names such as Intrepid 2F, Teb 45DF, AbbA Ultra, Luna Experience, Provoke, Deploy…  These are chemicals that are broadcast to keep from losing the war. We are doing battle against freeloading critters and pesky weeds that seek to throttle our production yield; if not choke off our margins of gain entirely. It is a challenge to figure out into which manner of classification we must group them. Insecticide, Pesticide, Fungicide, Herbicide?

In the vineyard we are up against hairy fleabane, horsetail, johnsongrass, powdery mildew, leafroller, leafhopper, and spider mites, to name the usual suspects.

spidex predatory mite in epic struggle with spider mite

There are other ways to fight. The organic option may become the holy grail at some point. For instance: ladybugs, lacewing and minute pirate bugs, are all voracious predators beneficially consuming the leafhopper larvae and their eggs.  Sixspotted thrips are a natural predators of the mites. Organically acceptable methods include biological and cultural control schemes such as oil or soap sprays. Unfortunately, the sure thing – nuke option – with chemicals cannot co-exist with the natural predators. There’s no discrimination between friend or foe.

A third solution? Genetic resistance as cost-effective and environmentally friendly method.  However, this would entail the deployment of a new grape variety — not a trivial conversion. Furthermore, our adversaries enately adapt to new environments and challenges. Who’s to say that they or some relation might not evolve to savor the newest iteration.

We already know that deviant pests can become tolerant to the nasty chemicals that we throw at them. In fact, every season we strike with different blended variations to catch them off guard.

And so the struggle goes. Like to join up for the cause? Thirst for learning? Here is a Knowledge Expectations link that outlines what one must command in order to gain the rank of [accredited] Agricultural Pest Control Adviser (PCA).

Winter Sanitation

Chemicals are used for controlling Navel Orange Worm (NOW) a pest that sometimes plagues growers, but another effective and sustainable method is sanitation. We marginalize a conducive breeding habitat by removing postharvest Mummie Nuts – a food source. Mummie shaking, either by machine or by hand using polling sticks does the trick.

some that are still on the tree

I took postharvest snapshots at our orchard last month:

and some are already on the ground

Removal is normally accomplished during winter, after rain and days of fog have weakened the nut’s attachment to the tree, allowing growers to

Blue Diamond Growers report photo

re-shake their trees, sweep and then grind the nuts using flail mowers. As noted in the following Blue Diamond Growers  report: some are not waiting and are sending hand crews into their orchards to knock the mummies to the ground using poles.  Everyone in the valley is hoping for another wet winter with ample rainfall. Unfortunately, last year’s deluge prevented quite a few from sending shakers into the orchards and after enduring the damage present in the 2017 crop, some are making extra efforts to ensure that their orchards will be free of all mummy nuts going into the 2018 growing season. The combination of over-wintering larvae coming into the 2017 crop, coupled with the high temperatures experienced in July, which prolonged the hull split resulted in extremely high NOW populations that created significant problems for growers throughout the 2017 harvest. 


Luckily, our orchard has escaped excessive NOW population.

Also, the report mentions that many growers [at this time] are applying soil amendments, such as gypsum or lime to correct soil salinity and pH problems. We have ordered gypsum and compost to be spread to combat our own salinity issue at the rate of 2 tons to the acre each.

Scientific Irrigation

I should think that a green thumb, who through tried and true experience  — knowing the synergy between plant, sun, and water — could dig down a few inches grasp and squeeze soil in his hand, look at the plant and say needs or does not need irrigating. To obtain this cosmic sense one would have to be mentored as an apprentice and have years of hit/miss experience. Naturally the goal is to have healthy and productive growing and have more hits than misses but there is an [upward] trending motive and that is one of ecological conservation. Also, water is an expensive resource. Here is the short course using Wateright – a scientific tool from the Fresno State University. What comes first the discussion or the explanation of terminology? Feel free to skip around to get a handle on it. It is some interesting stuff if you’ve wondered (scientifically) when to irrigate and for how long. Hope you don’t find it too dry (sorry)

Disclaimer : I don’t pretend to fully comprehend the interpretation of the output from the formulae or the strategic use of moisture control for plant yield and pest control. Follows is an exercise in learning discovery. I’ve gathered definitions of terms and immersed myself in the science of irrigation using one of several scheduling tools available to farmers. My primary presentation is how soil holds water (see available water) and how plants consume water (see Transpiration).

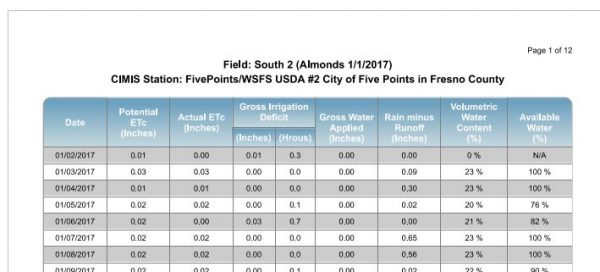
In this 2017 Wateright Water Balance tabulation for the Section 30 Ranch, weather data from Five Points/WSFS USDA is utilized to calculate ETo (see below) . This station is part of the California Irrigation Management Information System network (CIMIS). It is a network of standardized weather stations scattered throughout California which report weather data (emphasis is sun exposure / air temperature) on an hourly basis and a reference point for evaporative demand for our micro-region.

A Water Balance FORM used data from the CIMS e.g. Potential ETc column is pre-populated. There were some constants, such as soil type, irrigation efficiency, and canopy coverage assumptions that I had to configure. Otherwise, the only daily inputs to the form by the farmer is Gross Water Applied in inches and Rain minus Runoff in inches. The tabulation output i.e all other columns are then presented in the printout follows: Wateright Moisture Balance 2017 (download link)

Interpretation: The farmer would like to have the actual ETc match the potential ETc for maximum plant performance. He doesn’t want to see the Volumetric Water Content go much below MAD

Explanation of Terms that will help interpret the Water Balance tool.

ET is Evapotranspiration — the process by which water is transferred from the plant leaf to the atmosphere by evaporation. for most of the growing season, the majority of the seasonal ET is from transpiration. Transpiration losses are usually high and are directly linked to plant growth and productivity. This is because the pathway for transpiration in plants is the same one that allows for plant intake of carbon dioxide. Both exchange processes occur through pores called stomates on the leaf surface. Stomates are fully open when plants receive enough water through the soil and when both transpiration and photosynthesis are occurring at maximum rates. If soil water becomes limiting, stomates begin to close causing a decrease in transpiration and photosynthesis i.e. growth production

ETo is simply a reference number which represents an estimate of evapotranspiration (ET) from an extended surface of 3 to 6 inch (8 – 15 cm) tall green grass cover of uniform height, actively growing, completely shading the ground, and not short on water. All of the CIMIS weather stations throughout the state are situated within a small grass field which is optimally irrigated. Thus, instruments attached to the weather station datalogger measure weather parameters that would directly affect ETo estimates such as solar radiation, air temperature, humidity, wind and rain. This data is incorporated within the weather station’s database and calculates a reference evapotranspiration (ETo) number every hour.

ETc is calculated by multiplying reference evapotranspiration (ETo) by the actual crop coefficient (Kc actual), ETc = ETo * Kc actual. The daily ETo values are from the CIMIS weather station, and daily actual Kc values are calculated based on dates and values entered in the ‘field setting’ multiplied by a water stress coefficient (Ks), Actual ETc = ETo * Kc * Ks.

Potential ETc is calculated by multiplying reference evapotranspiration (ETo) by the crop coefficient (Kc), ETc = ETo * Kc. It is the best case scenario for the plant to operate at 100%

Actual ETc is calculated by multiplying reference evapotranspiration (ETo) by the actual crop coefficient Kc * Ks

Kc or crop coefficient is a numerical factor that relates to the ET of an individual crop. Tall grass has a different Kc than a tree as an example. The Kc might vary through out the growing cycle e.g. as the tree canopy becomes fuller.

Ks values range from zero to one (0 to 1) and reduce the value of Kc when soil water is not adequate to sustain potential ETc. When the soil water level is above Management Allowed Depletion (MAD), Ks is equal to one, and Actual ETc = Potential ETc. When the soil water level declines below MAD, plants begin to experience water stress, Ks values are less than one, and ETc will not occur at potential rate, Actual ETc<Potential ETc. The Ks values become increasingly smaller as soil dries below MAD.

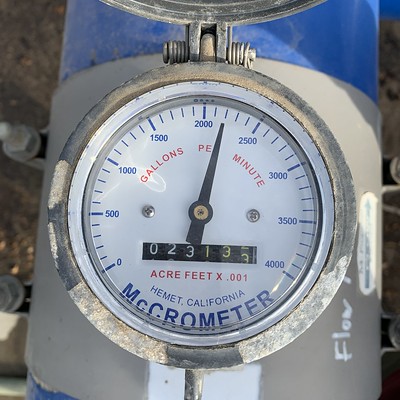
Gross applied water is equal to net applied water divided by our irrigation efficiency. We know how many acre/feet are applied in a given month but we don’t know exactly how it is proportioned (which Field). I make the assumptions that all fields receive the same amount. Convert the acre/feet (from our meter) to acre/inches and then divide the result by 220.62 acres gives the number of inches applied. Also, I don’t know what specific day the irrigation is applied; so I can only input the monthly total. That’s why is shows up on the last day of the month as a lump sum in the tabulation.

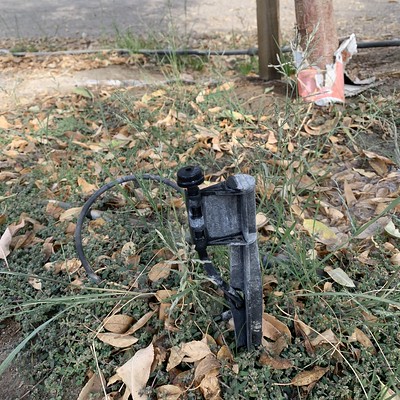
Gross irrigation deficit is the amount of water needed to bring the soil back to ‘field capacity’. It is given as depth (inches) of irrigation water and hours of running the well pumps. (Another constant I entered during tool setup. i.e. number of drip system emitters per tree and flow rate/per)

By default no runoff is assumed. Rain minus runoff is weather station data. I’ve added rainfall totals to the tabulation form using a nearby Personal Weather Station (PWS) at Kerman, CA

Available Water is the amount of water that is held by the soil between Field Capacity (FC) and Permanent Wilting Point (PWP) that crops can extract from the root zone. Water held between FC and PWP is considered to be 100% of available soil water. Soil water above FC cannot be retained and will be lost by drainage.

Not all the water between FC and PWP is Readily Available Water (RAW) to crops. When the soil water drops below a threshold value known as Management Allowed Depletion (MAD), crops begin to experience water stress and actual crop ETc falls below potential crop ETc. Moisture below PWP is strongly bonded to the soil and cannot be extracted by roots.

AW = available water
FC = field capacity
RAW = readily available water (to the plant) — MAD * AW
PWP = permanent wilting point
MAD = management allowable depletion — Default MAD value is 50%. MAD usually ranges from 40% to 60%

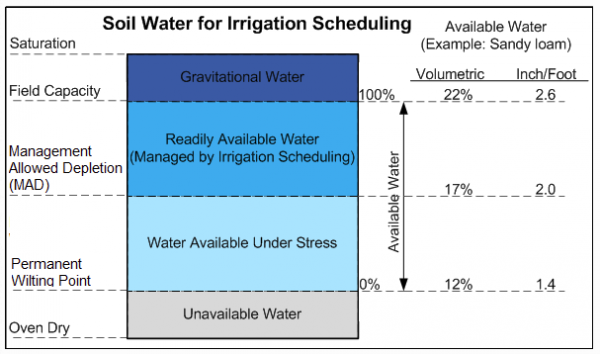
The Available Water measured in Inch/Foot refers to the holding ability of Sandy Loam. At FC this soil type can hold 2.6 inches per foot soil depth. Any greater than 2.6 inches and gravity overcomes and the excess percolates through.

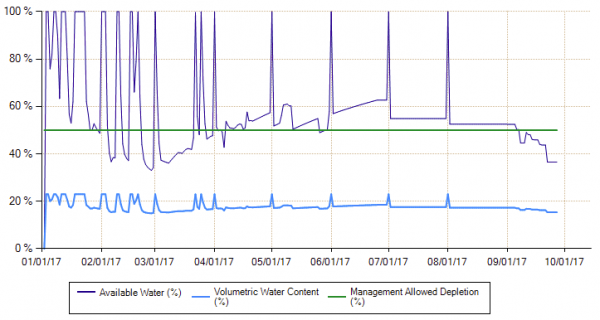
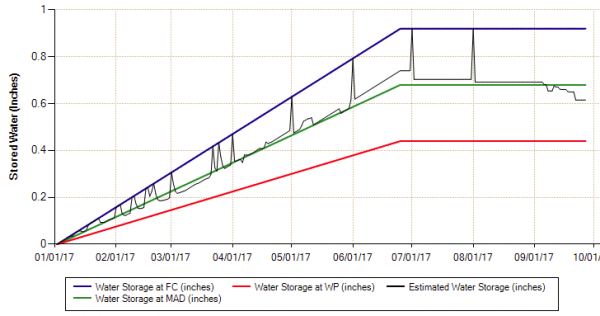
So, how did our year turn out? Note that the monthly irrigation meter reading is sum totaled on the last day of the month, thus the spike in the graph below. We know how many acre/feet (from the meter) are applied in a given month but we don’t know exactly how it is proportioned (which Field). I make the assumptions that all fields receive the same amount. Convert the acre/feet to acre/inches and then divide the result by 220.62 acres gives the number of inches applied. 

Executive Summary: As a rough guideline and continuity check, generic almond trees require about 38″ of water during their growth season. We had:

  • 8″ of rainfall to date
  • 44 3/4″ of applied irrigation (as of 8/31)
  • …for a total of 52.76″ gross applied water

On some dates the moisture content was above FC. This was primarily due to winter and early spring rainfall but was a good thing. Our fields do require periodic leaching to remove salinity and other accumulations that are naturally occurring in our aquifer sourced water.

Hmmm.  It would appear that in March the irrigation got a little bit behind… Observe that the Estimated Water Storage was slightly below MAD. I’m not making a judgment. This may have been purposeful. As I say there’s much to learn!

Sweep and Pickup

The last visual showed almonds scattered on the orchard floor left to dry – post tree shake. Moisture soon dropped below the desired 5% threshold (actual outcome 3.6 to 4.1%) and the nuts were ready for collection and transport. As these nuts are resting atop dry soil much of it loose, the standard procedure is to literally blow and sweep them into a single row. This formed row makes it possible for a pick up machine to straddle the row pile and scoop up the almond without running them over. Follows is a generic video of the blowing and sweeping action in which they tout their special berm brush to keep the dust down. I see it interfering with the drip hoses along the tree line center however. Attention: engineers in our clan! Is there a better way?

The sweeper machine blows nuts from one side of the tree berm to the open space opposite; while the main brush drives the bulk into the flat center space herding the nuts into a single row. They are retrieved by 
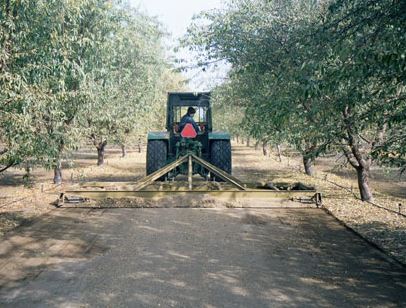
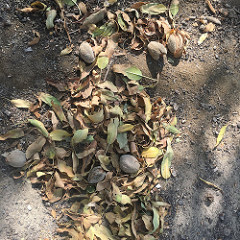
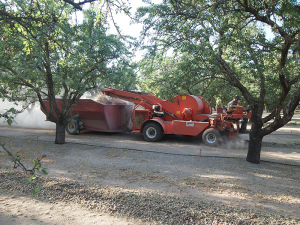
the pick up machine and carried by a cart in tow; leaving dirt and debris behind. Once the cart is full it is lifted hydraulically to dump its contents into yet another conveyance cart whose only purpose is to shuttle between the pick up machine and a semi-truck trailer awaiting roadside. In this way the pick up machine can continuously stay busy in the field.

An auger and belt elevator move the almonds from the shuttle to trailer. Once these truck trailers are full they will make their way to the weigh & inspection station and huller, but more about that — next time.

Bitter / Sweet

The wine grape harvest is in full swing. Originally scheduled to begin tonight, it was pushed forward to last Sunday on the holiday weekend. This was/is the [Gallo] winemaker’s call.

Relying upon art, science, and experience the winemaker determines the mix. There is a factor of timing for processing and capacity at his winery of course, but his primary concern is the sugar content of our Muscat of Alexandria. From sour to sweetness, the longer the grapes remain on the vine the higher their sugar content.  Grapes are sampled weekly by our Gallo representative and even daily when they get close. Our rep is monitoring the sugar which is measured by Brix. We, as growers, are required to produce sweet grapes with a Brix reading of at least 18. Historically we average 21-22 but the winemaker knows what he needs and this year Brix is averaging 19.

Another measure related to harvest timing is Rot. Historically we’ve seen 0% Rot and this year is not an exception. At some point as on-the-vine sugar content peaks the grapes lose their watery content and begin to shrivel (think raisins). Mold sets in so the winery mustn’t dawdle.

A drawback to mechanical harvesting is the inclusion of leaves, sticks, stems, and other MOG (material other than grapes) with the fruit. Some machines are designed or adjusted differently so mileage may vary, but in our experience MOG of .19 to .25 percent has been typical. This year we are seeing a significant increase to .54% This counts against our tonnage yield and will need to be looked at as we do have some control over this aspect.

There have been 24 truck loads counted so far which should be about 37 percent of our harvest yield. We should have our final performance report as harvesting concludes very soon.

Almond Harvest Dance

Nonpareil nuts are on the orchard floor. This variety,  52% of the whole, bloomed first and harvest was begun. The Butte, Fritz, and Monterey follow in order and the process will span the remaining hot/dry season.  Our tree rows are interspersed by design and the harvester must exercise care that the  fruit varieties are not intermixed. Nonpareil is the more desireable and commands the best price category for its shape and size. Contamination with another variety (a no-no) reduces the grade to that of  mixed nuts — the lowest price.

The nuts are separated from tree by shaking. 
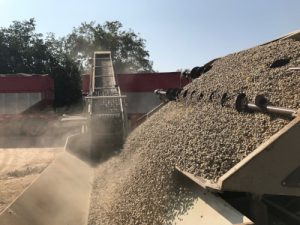
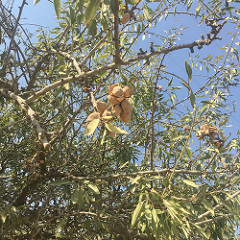
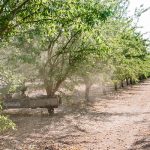
In early days this was done by laborers hand-knocking with sticks (poling), but is now mechanized due to the shear volume. The nuts in the center of the tree are the last to ripen. Moisture readings ~10% can be monitored. The nuts can be more difficult to dislodge if the hulls dry too much on tree but a test shake or two are usually the best indication that determine readiness. Optimum nut removal is 96 to 99%. Those that are left behind are not considered part of the harvest yield and become part of the orchard sanitation clean up proces$.

It’s a balancing act and a bit of a calculated race against nature as there is the eminent threat of Navel Orange Worm (NOW) and onset of early fall rain. The harvest is a significant [25%] portion of the expense budget. It is crucial that the process not begin before nut maturity but be complete before NOW pest infestation or mold issues. A too early harvest can result in excessive sticktights or curled hulls. They are a challenge mechanically and are graded as foreign matter in the delivery, a penalty.

Once on the ground the nuts must be left to dry for 1 to 2 weeks. Rain would be a detriment at this point. The machinery that process the nuts at the hulling site are impaired when nut moisture levels are too high. Almonds received in excess of 6.5% w.b.  must undergo the expense of mechanical drying. Almonds are contractually weight adjusted to a 5% ceiling. On the other hand, realise that we are paid by the pound and that moisture equals weight. Therefore 5% seems like a good target and we check the moisture statistic on the Grower Delivery Report at the end of the day.

Next: Sweeping and Pickup


Almond Fruit Maturation

Keen observers must realise that we have skipped the nut development stage. Recall that the play-by-play went silent after flowering and pollination; that is much more interesting because the process is quite visible, beautiful, plus added drama with the effects of spring weather. Since we like to keep things in-the-moment, Stage 2 Growth will be deferred until next time.

We are at Stage 3: Maturity. We can easily follow because, again, the phases are externally visible. The fruit components, beginning with the core, is the actual nut kernel, a hard shell, and enveloping these is the hull. 

The hull is of interest because at this stage it starts to split. The inshell nut is exposed in varying degrees. The kernel is still benefiting from irrigation water and nutrients but 85% of its growth development is already complete.

Hull Split  (dehiscence) is the term.  The hull is openable by hand at this point but in nature dehydration at the edges will fully expose the shell changing the shell color from white to brown.  A separation (abscission) between the hull and the tree begins. Once this happens the fruit might remain attached by a few fibers. These fibers will be broken during harvest when the tree is shaken and the nut falls to the ground.

There are external factors to consider during this split phase.  The hull must remain turgid by guarding against water stress and nutrient deficit to reduce sticktights. Too much irrigation risks hull rot. It’s a question of management timing; in other words, it only looks easy 😉

The hull split occurs from the top of the tree progressing downward. Harvest will usually commence at about 95% hull split but may occur sooner to avoid risk of NOW (Navel Orange Worm) or early fall rain.

Stay close! Harvest is next.