We farmers look for ways to maintain productivity. Aerial study by camera drone, soil moisture sensors and weather from satellites are tools for data focused farming. In a recent post we discussed irrigation water testing. Last month almond tree leaf samples were collected and the leaf tissue analyzed and our West Block and East Block results are in. For almond, leaf analysis is more useful in diagnosing mineral deficiencies and toxicities than is soil analysis. This is because soil analysis does not indicate whether plants are able to uptake the nutrients. The leaf tells us about [nitrogen] nutrient levels which is crucial for plant health and yield. (‘you are what you eat‘)
D & D Agricultural Laboratory performs the service for us. It would be interesting to be on site to witness the leaf collection method. For example, do they sample the 4th tree in every 4th row? Should you look at strong trees or weak ones? From which part of the tree to they take the leaf and why? answer
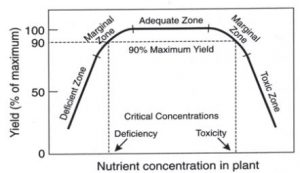
In the laboratory, they wash sample leaves in a weak detergent mixture, rinse them in distilled water and dry them at 65 degrees C. The leaves are then ground and a subsample analyzed to determine the content of the requested elements. The macronutrients N, P, K, Ca, Mg and S are usually expressed as a percentage and the micronutrients in part per million (ppm). These results are judged against known standards. For each nutrient, there is a correlation between its concentration in the plant and the yield of the plant.
The curve below describes this correlation. This curve is referred to as a “yield response curve”. [ reference , reference2 ]
Interpretation is provided graphically and comparatively over previous year efforts by our lab. Tissue testing does little to explain the reason for the nutritional disorder. It is only an alert and can help to identify or explain visual cues.
So, how are we doing? Sampling is best done in July but in this early peek; things look good. Someday technology may allow growers to identify what an orchard needs and provide remedy on a tree by tree basis. That would truly be Big Data.
Thinking out loud: Would there be more value to more focused results? 40 or 20 acres vs. two 80-acre blocks? I imagine there would be some variability in the soil within 80 acres, but maybe not enough to justify separating the data into eight segments vs. two.
Also, it would be interesting to compare these results with your interventions efforts (leaching etc.) historically. Do you have access to data along those lines?
Thanks for all the time you’re putting into this site U. Clint!
Good point Cristina. The soil does vary and you can see the effects in the satellite photo. https://drive.google.com/open?id=14ZWJqaxp9WfCcP-VRdiOyjXGvAE&usp=sharing
The canopy growth blankets the orchard floor in areas that appear to be thriving. In others, bare ground is visible between trees.
https://docs.google.com/spreadsheets/d/1s7eMTfmB_HLvX4bbs-mKx0KzvjS-Z3sc8GdCya3W5W4/edit?usp=sharing I think that we can say that the 2017 test indicates that the Sodium has come down. Great!
I note that the lab that we used in 2012 did use 4 sample locations by dividing the two East and West blocks into North/South quadrants. More sample locations can only improve the picture. The variable cost from D & D Labs is $55/per individual sample collection/analysis.
I can only surmise that the current method is either random or from the same spot. I would like to know which spot! My preference would be to geo-reference the leaf tissue sample test location with the photo because if the sample is from a deficient area then we have to be careful that the remedy doesn’t become toxic in a lush area where nutrients are currently within optimal ranges. If we test amongst the healthy trees then we are ignoring the ones that need help.
Production yield outcomes are difficult to attribute to our intervention because of other control variables which do not remain constant. Result in a given year may be skewed by a weather event for instance. We must be doing something right though. Compare and contrast with this view from year 2010 http://www.evernote.com/l/AdRnJmxNwQ9ALYbRhVPRTt-PVSMy_V_6AeE/
Thanks U. Clint!
“My preference would be to geo-reference the leaf tissue sample test location … to be careful that the remedy doesn’t become toxic in a lush area where nutrients are currently within optimal ranges.”
I agree, although I doubt D&D would be able to easily supply that information. Maybe next year they can note the GPS coordinates with each sample?
~C
P.S. The 2010 orchard photo is astonishing! So bare!