…and Contest! Woah boy. The Panoche Creek Packing publishes a newsletter titled: In A Nutshell; subtitled: Predictions and Trends for the  California Almond Market. Panoche Creek markets our almond crop so it’s their dutyto keep tabs on industry trends regards to sales pricing and volume. The two are linked of course but the volume aspect is of particular interest to them because — job security!
So every year they host a just for fun event where their Grower Customers (like we) are invited to submit a value number that predicts the future. The results are published and a winner announced.
2017 Crop Estimate Contest
For our 2017 crop Estimate contest the prize will be $ 1,000. This year’s rules follow: The closest guess to the receipts of the 2017 crop, as shown on the March 2018 position report published by the Almond Board of California, will be the winner. The winner wilt be rewarded with a $1,000 cash prize. One entry per farm organization… etc. etc.
I am not one to participate in lotteries, raffles, and drawings and less so in a public (real names) pronouncement of a guess. The aforementioned results are tabulated and if your submission happens to land too far outside the crowd median one might appear, ahem — uninformed. Embarrassing.
I did establish some Cred when I actually WON! the prize a few years back. Now I’m wondering how I can repeat that performance and live up to the fame. If this year’s guesstimate is way off the mark this time then I will have been a won-hit-wonder and everyone will know.
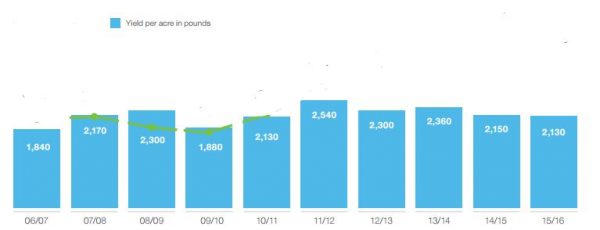
How does one derive a good number? Well “Ed”, the last year’s winner, bet 2,126,896,000 pounds (against 2,131,006,583 actual). That’s a lot of nuts. The figure that I picked in 2014 was 1,901,449,000. Since then statewide there have been existing orchards removed and new orchards established. There are sources that monitor bearing acreage. Next to know is the average yield per acre. Yield in pounds per acre X number of acres = that big number in billions. The trick is to predict the variances be they inaccuracies in the acreage estimates or fluctuations in the yield due to weather, acts of god and mother nature.
Historical Yield per Acre in pounds
Historical Bearing Acreage
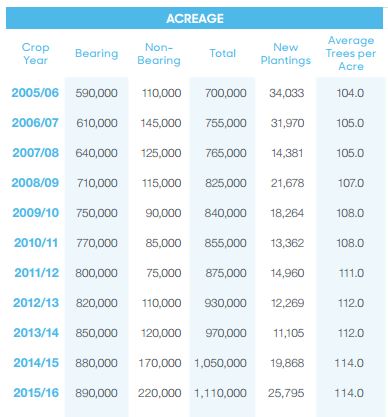
[ source ] California Almond Board
It can be a challenge to interpret objective measurement reports. There is science to this and I’m sure there are people who are paid full time salaries to inform market players. Maybe just add 10% to the last guess and call it done.
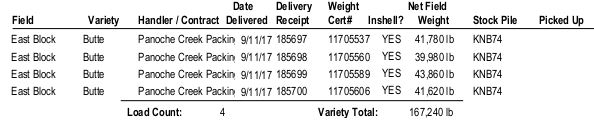
But wait. There’s more to it. There is a keyword in the contest fine print that says: receipts. We have to analyze too the marketing aspect. Almond Packing Marketers (such as Panoche Creek) don’t always sell an entire crop in the year period of harvest. The excess is called a Carryin and this can amount to millions of pounds. The receipts amount to the number of pounds marketed. Best have a look at last month’s Position Report and will try and decipher. Evidently there is a 3% Loss of the inventory every year due to critters, decay, age; this explains the difference between production and the remainder carryin/carryout. The tabulation below shows the receipt variable.
| Year |
Yield |
Acreage |
Production |
Receipts |
| 2007 |
1,840 |
610,000 |
1,122,400,000 |
|
| 2008 |
2,170 |
640,000 |
1,388,800,000 |
|
| 2009 |
2,300 |
710,000 |
1,633,000,000 |
1,606,372,490 |
| 2010 |
1,880 |
750,000 |
1,410,000,000 |
1,395,051,752 |
| 2011 |
2,130 |
770,000 |
1,640,100,000 |
1,618,404,740 |
| 2012 |
2,540 |
800,000 |
2,032,000,000 |
2,012,824,704 |
| 2013 |
2,300 |
820,000 |
1,886,000,000 |
1,878,596,013 |
| 2014 |
2,360 |
850,000 |
2,006,000,000 |
2,003,500,548 |
| 2015 |
2,150 |
880,000 |
1,892,000,000 |
1,888,243,454 |
| 2016 |
2,130 |
890,000 |
1,895,700,000 |
2,131,006,583 |
| 2017 |
? |
?? |
??? |
???? |
In a nutshell (sorry) we have the production to estimate and then figure how much of that as well might be counted as losses and then how well will the market absorb any carryin.
- Our pick for 2017 should be: ????
- Our number in 2016 was 1,989,499,000
- Our number in 2015 was 1,789,000,000
- Our number in 2014 was 1,901,449,000
 [enlargeable]
 [enlargeable]
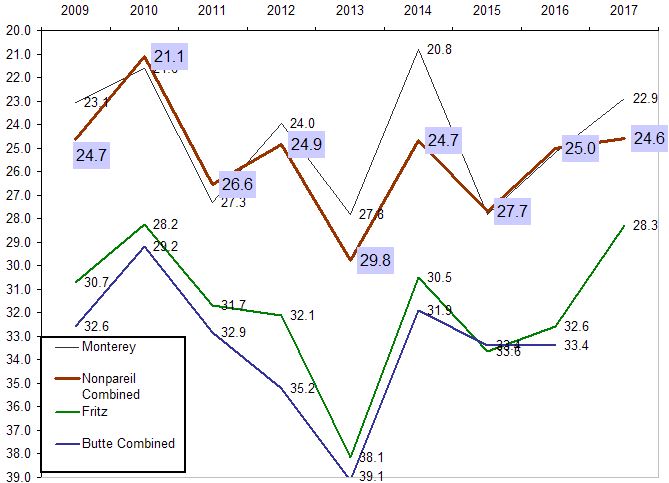 [enlargeable]
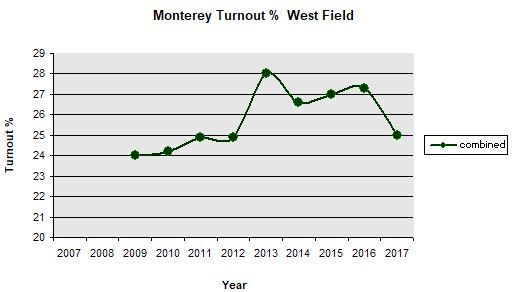
 varieties, and control contamination, the huller must do the same. The product is exposed and rain and fog which will be the norm soon. In the event of early rain then plastic tarps can be used as cover but this is labor intensive and can be problematic. Their best bet is expedited processing.