Our Irrigator uses an old school shovel; poking a hole, looking at dirt. With the installation of our new Irrometer IRROcloud IC-10 we can perform the same task and from afar — no shovel necessary.
An array of sensors buried in the active root zone measure soil water tension. A sensor is an electrode embedded within a specialized granular matrix. Water in the soil exchanges with the matrix, providing an electrical measurement of soil water tension expressed in centibars (or kPa). Sounds like magic. These sensor readings are captured by a data logger and uploaded via cellular to the Cloud allowing us a real-time inspection.

This is actual output from 20 JUL through 01 AUG looking at the 1 foot depth sensors. Moisture is depicted on the Y axis. The X axis shows the individual days.
The [gray] line is an average of the moisture sensors in the root zone and the [blue] bar graph(s) are recorded irrigation events. The upper band of the chart equates to DRY and the lower scale WET. Observe that the typical peaks and valleys correspond to the heat of day and coolness of night. The significant dip (valley) concluding an irrigation set shows a dramatic increase in soil moisture.
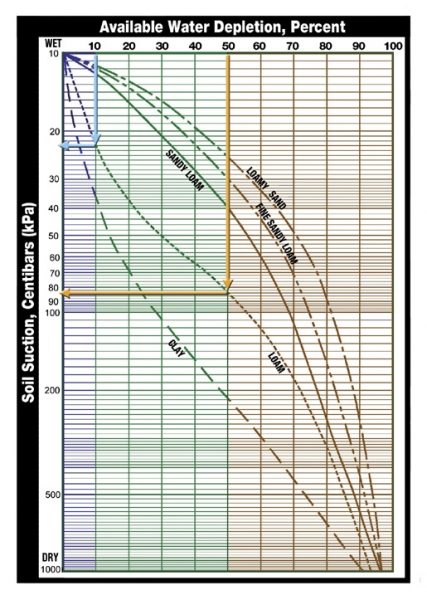
The general idea of course is to manage the irrigation; keeping the moisture level within an ideal (white band) range. But, we shall quantify this with the following graphic:

10% depletion of available moisture will determine the WET reference value.
50% is a generalized recommendation for a DRY depletion threshold (point where a plant can not easily extract remaining moisture from the soil without stress)
Based upon our Sandy Loam soil one can use the graph to determine the desired moisture range. Entering the chart at 10% and dropping vertically to the correct soil type curve and then coming across horizontally the result would be: 14 centibars as the wetter threshold. Doing the same only entering at 50% on the dry end equates to 40 centibars. [see basics] in between 14 and 40 centibars (the white band) should yield vigorous thriving vines.
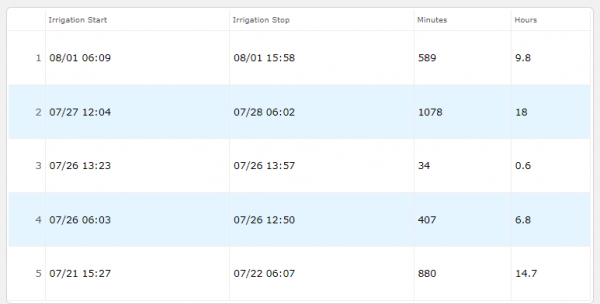
This next image is the irrigation tabulation showing the 5 data sets reference the bar chart atop.


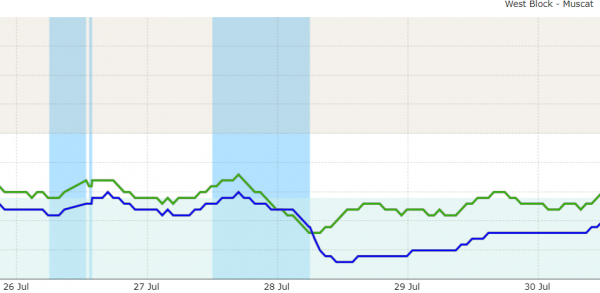
Blue data line is a 2′ depth sensor
This zoomed section shows an inefficiency during the 27-28 JULY irrigation event. The drip system was running for too long (18 hrs.) sending water below the root zone; wasted. The previous set on 26 JUL with a 6.8 hour duration was more elegant (excepting the 0.6 hour subsequent false start).
20-25 centibars might be a good upper end target to begin an irrigation. How did our Irrigator do? Keeping the moisture within an acceptable band was achieved albeit a tad on the wet side being careful perhaps. Not bad considering the shovel method.