At least once a year we coordinate with an expert to measure Irrigation Well output performance. As you know, access to water is a primary element for we farmers and these evaluative tests allow us to keep tabs. There is a separate test to learn about water quality but the objective in this discussion is to determine its availability, volume, and at what cost.
A recent test report shows us quantitative data points that can be tracked for use as historical trend or inserted into formulae as variables. Key of these measurements are:
- Water Table – a measure of depth in feet to the beginning of earth’s natural aquifer. There are two subsets: Standing Water Level and Pumping Level. The difference between them is known as Draw Down. Draw Down happens as the pump puts demand on the pool. A large number value might be indicative of blocked or broken well casing or a warning of well resilience. Did you know that a camera can be sent down for a look see? The Wells in our application are drilled to a depth of 600 feet, insuring unimpeded inflow
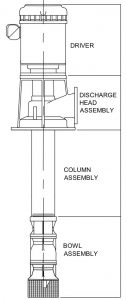 access to the extended perforated well pipe casing. The turbine pump bowls however, only extend to the Pumping Level [and then some]. Realize that the deeper the pumping bowls the more work (cost) in lifting to the surface so we position the shaft mounted bowls only so far down. Extra allowance is made in depth positioning for inevitable reduction of the global water table as future deepening of the turbine bowls is not a trivial expense.
 - Flow Rate – of imediate interest to the irrigator; our trees and vines require copious amounts and as a generalization, the more the merrier (a mature tree requires on average 65.625 gallons per day at peak season). Pump output is quantified in gallons per minute (GPM). A typical floor value on an irrigation scale such as ours is 1,000 GPM from an individual Well. A lesser value is cause for concern. 2,000 GPM would be considered exceptional. Our irrigation Drip System plant by design can handle up to 2,550 GPM.
- Energy – Kilo Watt hour (kWh) is a measure of energy. A 200 HP electric pump under full load might use 176 kWh (176,000 watts over the period of 1 hour). FYI, your vacumn cleaner might use 1 kWh (PG&E would charge $0.20). Our electric motor spins at a design rotation speed of 1900 RPM. As the work load increases so does its energy draw (up to its 200 maximum design horsepower). Work load is a function of Total Dynamic Head, and condition/adequacy of the pumping bowls. We can relate then, the water flow rate with the energy consumption to figure overall efficiency.
Formulas Used:
- Drawdown = Pumping Level – Standing Level
- Total Dynamic Head = Pumping Level + Gauge Ht + Discharge Ht + (Discharge psi x 2.31) + Discharge Head Loss + Column Loss
- Well Yield = GPM / Drawdown
- Input HP = 4.826 x Kh x (Revolutions / Time)*80
- Input HP (as kW) = Input HP x 0.746
- Brake HP = Input HP x Motor Eff – Thrust Bearing Loss – Column and Shaft Losses
- Water HP = GPM x TDH / 3960
- Impeller Efficiency = Water HP / Brake HP x 100
- Pumping Plant Efficiency = Water HP / Input HP x 100
- AF/day = GPM / 226.27
- kW/day = Input HP x 17.9
- kWh/AF = kW/day / AF/day
note: AF is acre feet
These and other lesser but good to know markers (e.g. sand output), are useful in Well comparison and trend analysis. We want to know in advance about predictive issues for budgeting and downtime maintenance planning.