Modern Irrigation: We track a handful of metrics. Some of them are constants e.g. the pricing rate of energy. There are data points such as pump operational hours that are logged in tabular form. All of this information can be spun with a spreadsheet yielding useful intel.
Recall a previous post on scientific irrigation? It made reference to how much moisture a plant needs to maximize the photosynthetic process and thus crop harvest yield. Too much water is a waste and not enough is detrimental. The task then is to compute how much water are we putting down.
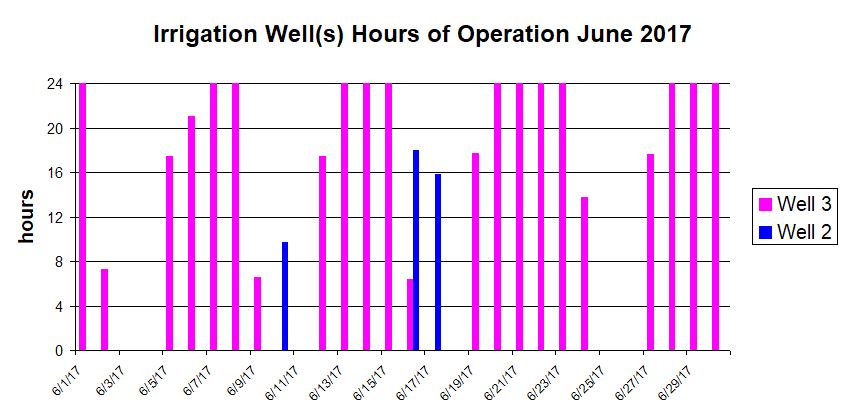
A first thing to understand is the concept of irrigation sets. Each of the vertical bars indicates a set. Think of an irrigator person adjusting or setting the flow so that he can leave for a few hours or attend to other jobs. (He needs to do this precisely because if the flow is too high then flooding occurs) The month of June requires a lot of water. It’s a vigorous growth period. Here you can see that the irrigation set can last for multiple days and extend into a 24hr interval.
Were’d this data come from? In times previous the reporting was scattered and usually furnished in an end of month statement summary. For example the utility company would tell us the energy total for the month and at the end of the period a field hand would read a flowage meter and pass along a reading. Knowing the previous months reading we could find the difference and figure out a total. Bare bones basic and lacking any detail, right? Did I mention that the report dates rarely coincide.
These days, we have smart meters and telemetry that will allow us near real time data collection. A side effect is that the quantity of data can become immense and we’re back to square one trying to make sense of it.
Gathering the data is a first challenge. It comes from scraping an online file and of course it is in a format that doesn’t present in any concise way.
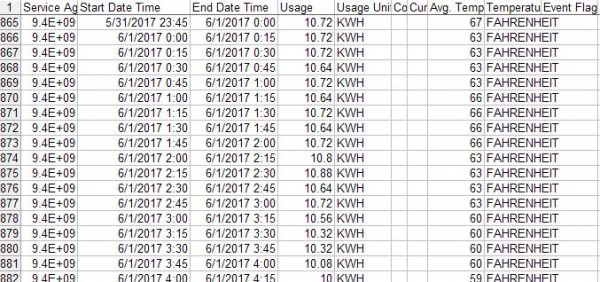
This is just a snippet. It has 3,500 rows and that is just for half the year and only one of the wells! So next step is to fold, spindle or mutilate that raw data to give it meaning.
Observe that each row is a 00 :15 minute window. A daily output however is sufficient granularity. Further we need to convert the energy usage for presentation in layman’s terms. We want to know for how many hours the pump motors ran, on what days, and what proportional share of energy they each used to move “x” amount of water.
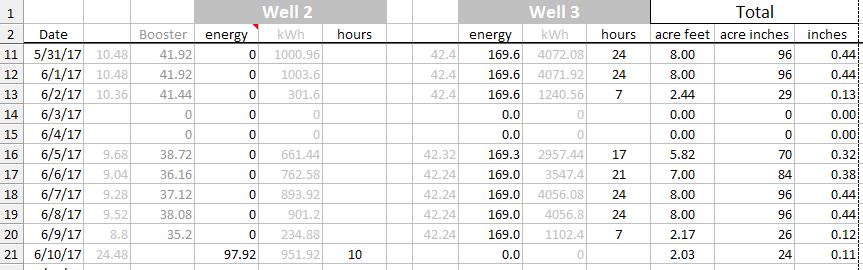
“X” amount of water: As said, the water flow meter is our primary tool but only a monthly itemization. There are some known constants that will break this down into a daily amount. We know the pumping capacity based on recent testing and now that we have the daily usage (above) we can formulate the output. More variables and constants and arithmetic that we use:
- output in GPM is 1,792 and when multiplied by 60 converts to gallons/hour
- 32,585 gallons == 1 acre foot (an old school agricultural unit of measure)
- divide 32,585 by our gallons per hour determines how many hours of pumping
- energy consumption rate expressed in kWh is 169
- multiply hours of pumping times 169 to find energy per acre foot
- cost of energy is $0.19 per kWh
- multiply cost x energy results in cost per acre foot
- 1 acre foot x 12 converts to acre inches
- acre inches divided by 220.62 gives us inches of water applied
You get the idea. We can discover all kinds of things; cost per hour, which well and pump delivers the water for less, etc. By studying the data we find how the wells are managed.
We had three wells: #1, #2, #3; oldest to newest. #1 has been retired from service (but could be recalled for emergency use). Our irrigator has the ability to select between them. It was interesting to observe (from the data) his pattern (not that it made any sense 😉 The irrigation sets are managed by timer clock. It is typical that Well 2 will operate throughout the night — shutting off automatically at 06:45 when Well 3 is brought online. Both wells are rarely operated simultaneously even though we have that capability. Hmmm, answers lead to more questions sometimes.
More enlightenment: In September (2017) there was a system problem. 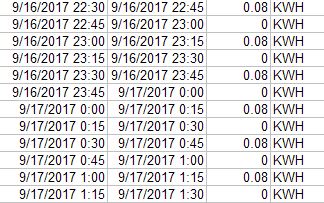 The irrigator finally remedied but this telling data trend would have caught it. The recordation value of .08 is below par and the interval is unusual. This pattern repeats many times. What is happening is that the motor is attempting an auto startup but failing in the attempt. Evidently the irrigator’s timing of his inspection rounds was such that he missed the momentary start|stop anomaly.
Irrigation Old Time: The Irrigator is practically redundant. See how much we can do from the remote office? Still, we need someone to establish the Sets. I remember when the Irrigator carried and actually used a shovel. The long handle was convenient for leaning upon 😉 Rubber [Irrigator] boots, and a cowboy hat to block the hot sun completed the look. The Irrigator made his set and watched for water that was getting away or (more hopefully) about to… It was a learned procedure — kind of like the more meaningful methods of today.
Holy spreadsheets, batman! That’s a fine job you did to make that into a final, informative graphic 🙂