Category Archives: Educational

Section 30 and a bit of history

What’s a Section?

As the country expanded West there was a need to describe acreage so that it could be subdivided and settled. Surveyors marked out land plots using a rectangular format of townships, ranges, and section lines.

A survey township is divided into 36 sections, with a section being 1 mile square and holding 640 acres. Sections are numbered boustrophedonically within survey townships as follows: ( table is north up)

654321
789101112
181716151413
192021222324
302928272625
313233343536
Numbering Convention for Sections and therefore the section number to the west of section 30 will be 25 in the neighboring Range (17 E)

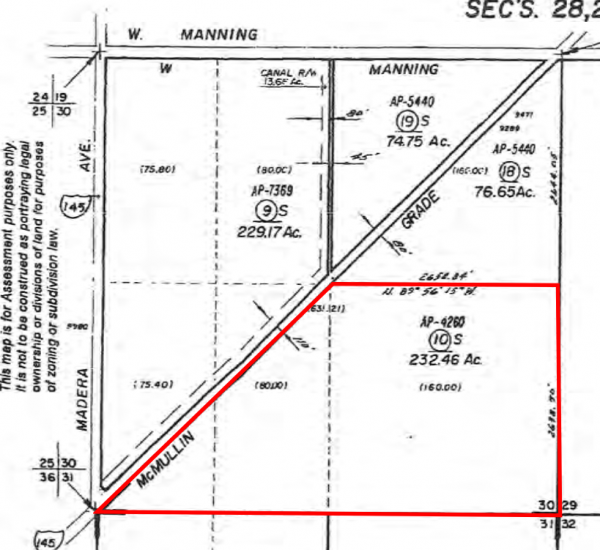
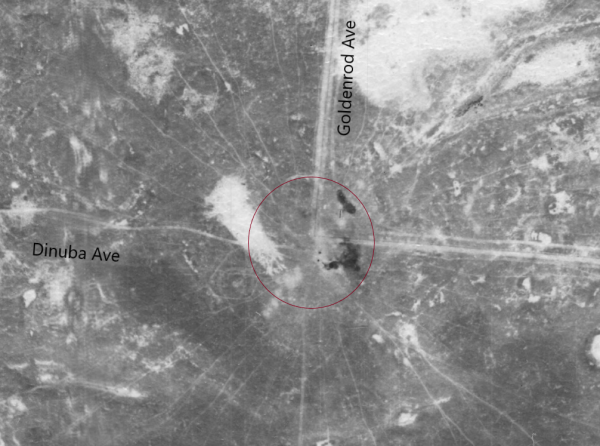
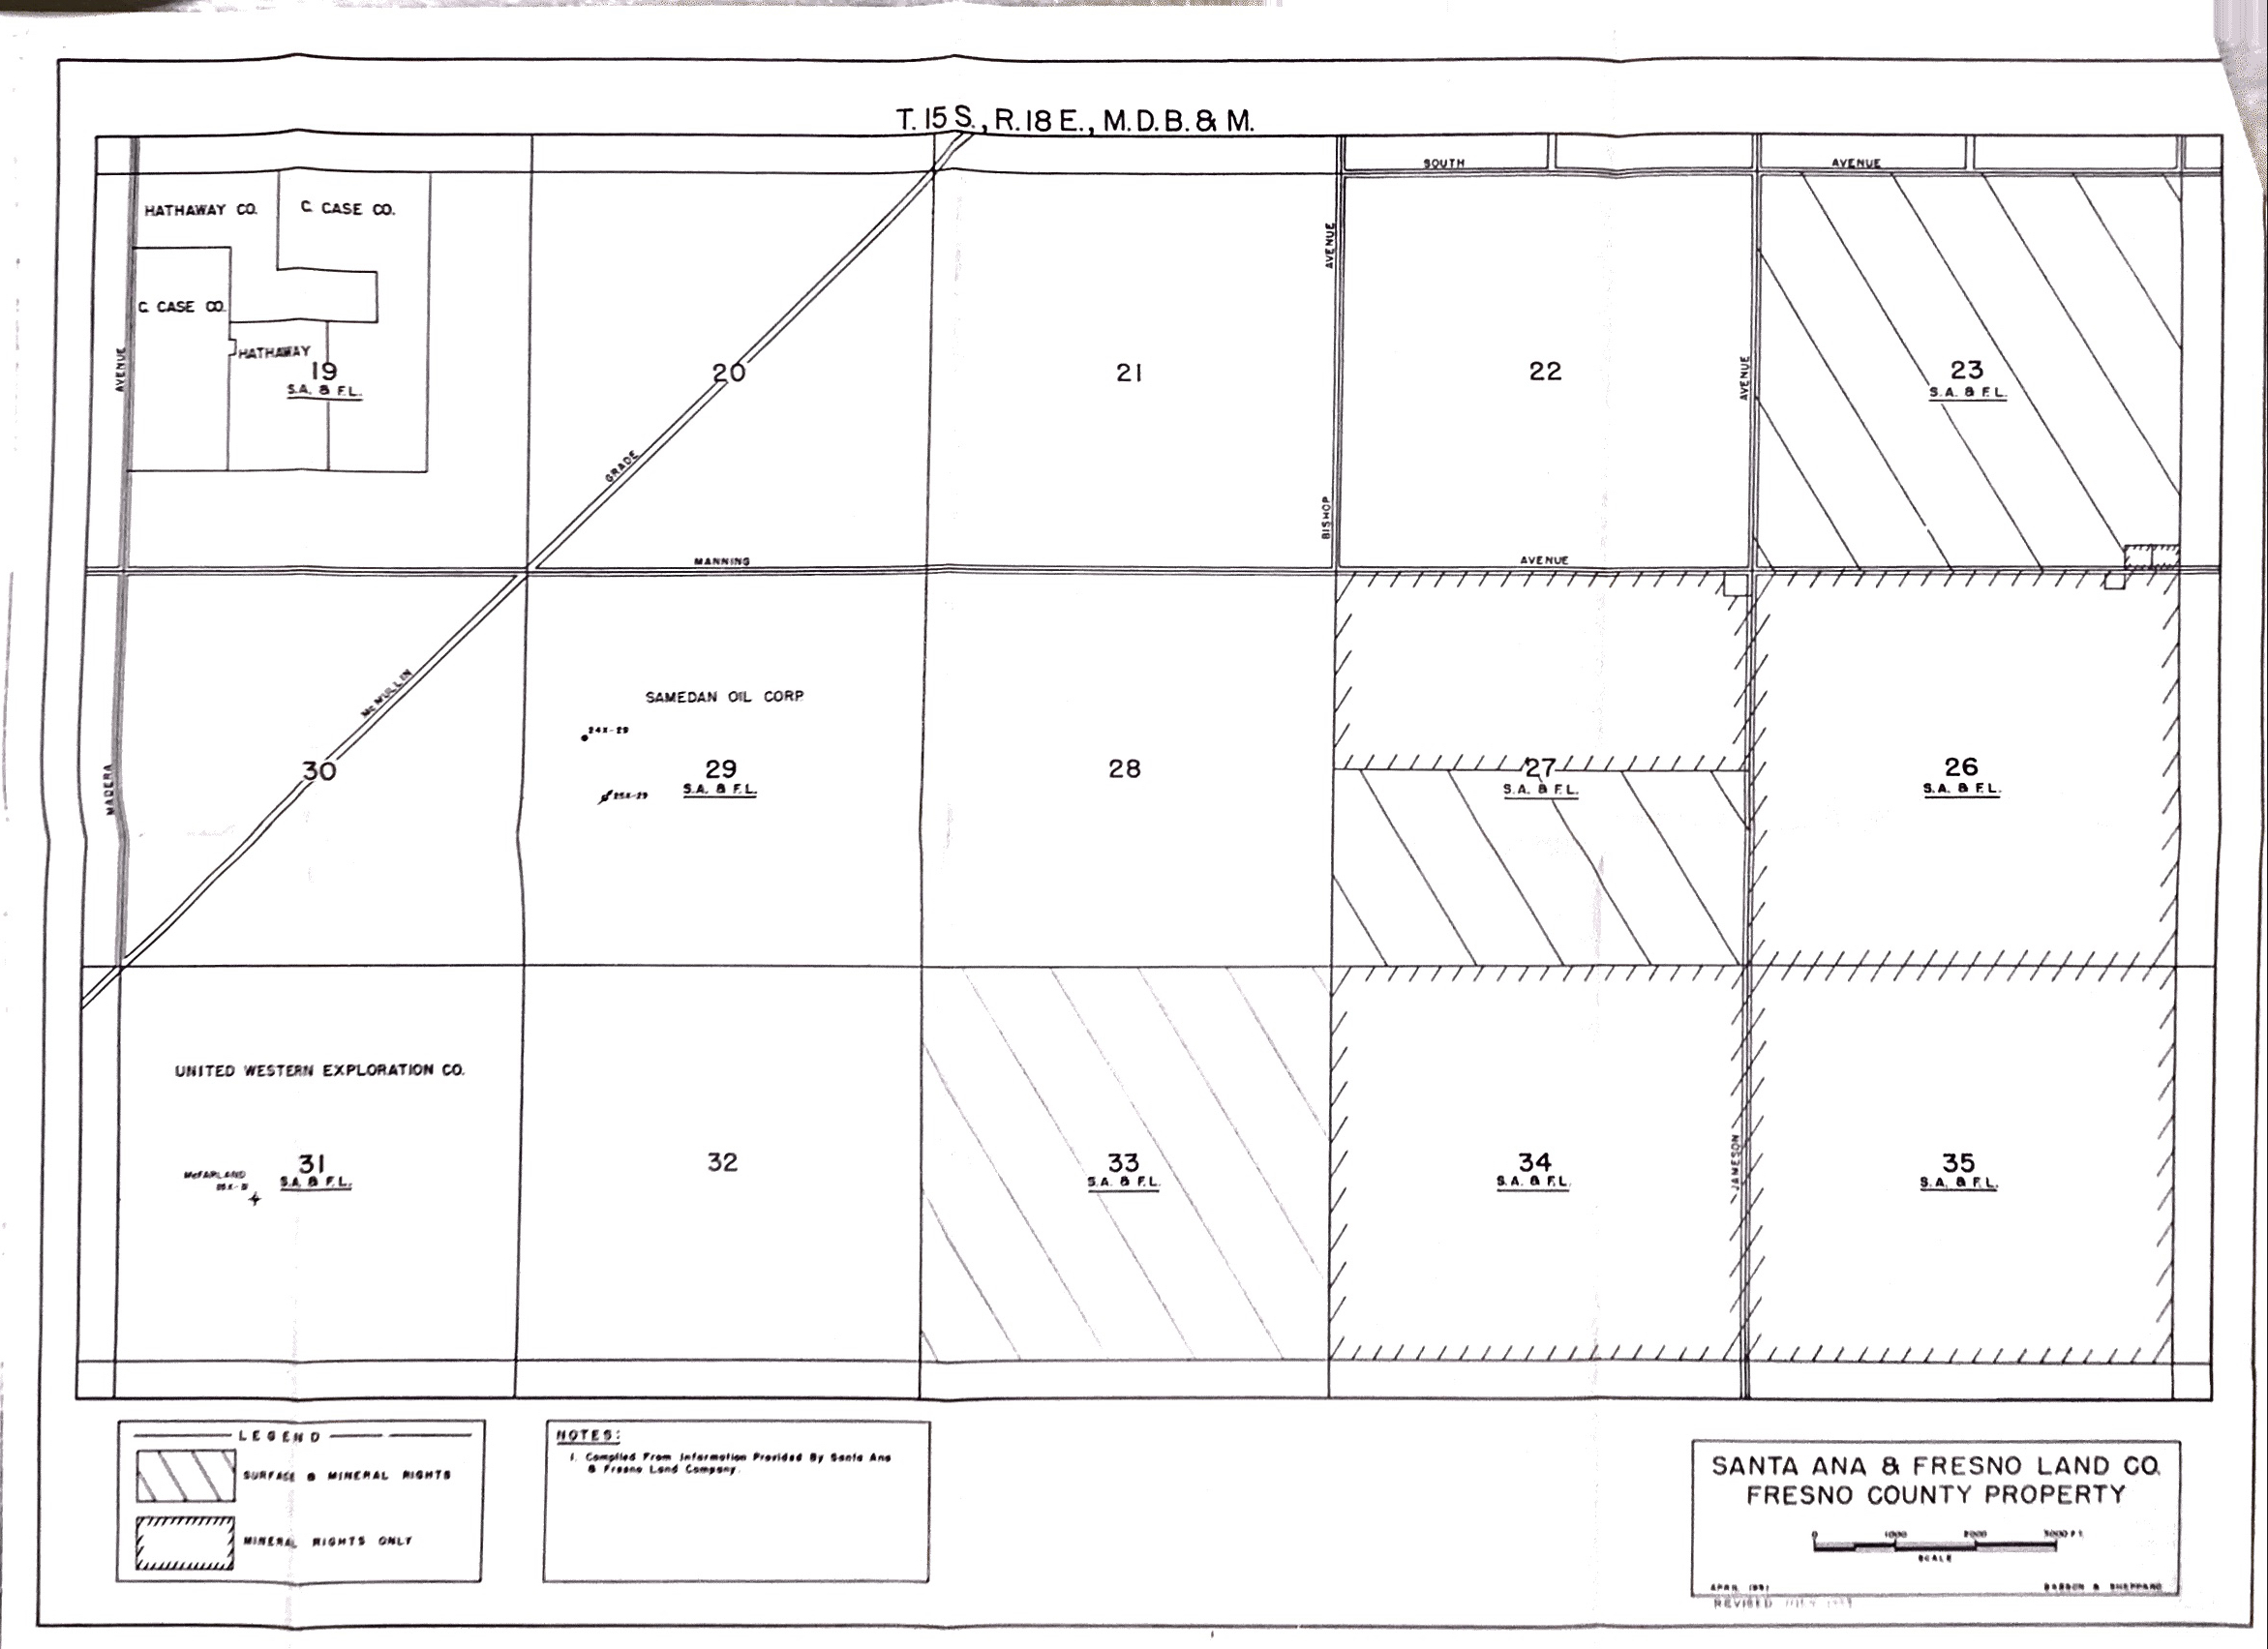
Our Section – 30 – south half, shaped as it is…

It might be fully described as SE 1/4 and SE 1/2, SW 1/4, Sec. 30, T.15S., R.18E. M.D.B. & M or in plain English, the SE quarter and SE half of the SW quarter of section 30 township 15 South and range 18 East – Mount Diablo Base as principal meridian.

The existence of section lines made property descriptions more straightforward. The establishment of east-west and north-south lines (“township” and “range lines”) meant that deeds could be written without regard to temporary terrain features such as trees, piles of rocks, fences, or the like. However, in our case the public roadway adds a complexity so we must rely on the record of survey filed in Book 22 of Records of survey at Page 73, Fresno County Records.

We are in the south half of Section 30 (subtracting ~ 80+ acres orphaned by S McMullin Grade, a diagonal bisecting our section)

Fresno County Tax Assessment Office depiction of Section 30

You’ve heard this expression in story and song: “lower 40” or “back 40” — 40 acres was reference to a quarter-quarter section. There’s more in-depth reading on the PLSS design.

The Backstory Part

Historically these area lands in situ were of low value. The composition of the soil was alkali, predominately sandy loam, underlain with hardpan. There wasn’t a water supply so farming crops was unrealistic. Some areas in the vicinity were perceived to have petroleum reserves. Companies such as Getty Oil and Shell (circa 1923 – 1941) held oil leases. Few wells were able to extract oil in commercial quantities though, as this portion of the valley was at the northern extreme of the known Bakersfield oil resources.

Maintaining speculative hopes for oil, land conglomerates such as the Santa Ana Land Co. derived income primarily from cattle grazing leases. We leased acreage from Santa Ana. Our herd of steers fed on dry grass and hay supplement before trailing them to the [Noble] cattle feed yard for finishing. Years afterward this range where we ran cattle was acquired by Diego Lissi of Switzerland, and is renamed Terranova Ranch.

Sant Ana & Fresno Land Co ( see full size map close-up )

Land holder William H Noble, a wealthy individual from San Francisco, no doubt derived income from oil leases in his day but by the time we were on scene any wells were at their economic limit, if not fully abandoned. In 1962 we acquired land from Mr. Noble. Rik and Estee Strombotne purchased 230 acres within Section 30 with clear intent to develop their new parcel and to begin farming it.

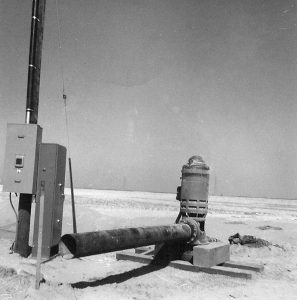
After the land was graded level and ripped, an irrigation well was drilled and gravity pipelines laid. Agricultural gypsum was applied and alfalfa planted. The chemistry of water, alfalfa crop and gypsum was the established method for reclaiming soil in the area. 1 We can be considered founders; one of the first in the area’s transformation and reclamation.

1 Wes Sprague – President 1968 – ____ of the Santa Ana and Fresno Land Company beginning from year 1909 owner of 9 Sections

Our earliest neighbors made similar efforts:

  • Ken Peelman Jr. (leased) Sec. 19
  • Jack Cardwell (leased) Sec. 29, 31, 33
  • Klepper & Little (leased) Sec. 23 and south half of 27
  • Coelho Brothers – Sec. 21
  • Hartwig Brothers – north half Sec. 27
  • Rau Brothers – Sec. 26, 35
  • Britz Family – Sec. 32

Our neighbors today: (click on a colored block to view)

The Naming Convention

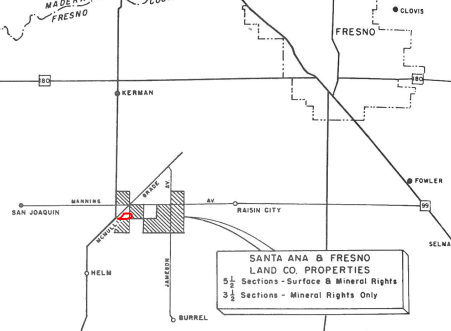
Our property is also known as The Kerman Ranch because of its proximity to the city of that name but is actually closest to the unincorporated community of Helm, CA. We refer to the land as The Section 30. Technically not a Ranch by definition but from start beginning, when we cowboyed, it was open-range [ranch] land. Our farming venture transformed the Section 30 piece and made it the success that it has become.

Way back when

The Google Earth app gives an excellent [and free] view vantage that previously was only accessible to those willing to pay the expense of a chartered aircraft or helicopter equipped with cameras. The satellite photos only go back about 20 years anyhow so I was tickled to stumble upon early imagery courtesy of our local library. They have been painstakingly indexed and digitized so as to be searchable and retrievable online.

June 28, 1961 for the United States. Commodity Stabilization Service

The complete photomosaic was flown by Aeroflex Corporation, Robinson Aerial Surveys Division . There aren’t many clues in this picture due to lack of identifying infrastructure back in the day, but the dark diagonal line in the center is what was then called the Coalinga-Fresno highway better known today as McMullin Grade. Madera Avenue drops straight down from Kerman to the North (center of picture) and meets an end at our diagonal. That point is a good reference as our property is directly across the highway.

March 13, 1950 for the United States Department of Agriculture. Production and Marketing

This next example, was flown by Aero Exploration Co., Tulsa, Oklahoma. Unfortunately, the corner tip of our future property (referenced above) was not part of this survey. I have labeled the marks this time so you can get your bearings. Note the red circle that I drew. This is the Southeast corner where we eventually drilled our very first deep water well. irrigation transformed the place as, you can see, this land was forsaken arid desert.

May 19, 1942 for Fresno County highways

This detail clip from a very early survey again depicts the Well location and is interesting because you can observe outbound radiating lines like spokes. These would be cattle trails that culminate in this low spot where the herd would return to drinking water. Drinkable is open to interpretation. The broad brush white areas in the picture are not sky clouds but rather concentrations of alkali rendering the soil poor. Cattle grazed this fenced land as winter rains would produce grass — along with scrub and tumbleweed. Slim pickens. Dinuba Ave is dirt road even to this day but back then you might recognize that it is none too straight in line. The land, while appearing flat in this overhead was in fact uneven and this road was merely following the elevation contour.

Massive leveling machines smoothed things when we acquired and developed the property in 1961/1962. Gypsum was spread to counter the alkalinity and the soil deep ripped to break hardpan clay beneath the surface.

We are so used to what it looks like today in all its splendor. But it was a process and these remarkable records are quite a contrast.

Paper Trail

Making sure that no Almonds have been lost or overlooked along the way…

In the field block almonds are retrieved from the orchard floor and shuttled via a motorized cart to a truck and trailer accessible loading area. They are placed on a conveyor belt that elevates the almonds to the top of the trailers and loaded for transport. You can see a “funnel” on the bottom so that the almonds can be unloaded at the the huller/sheller.

Even though our almond  harvest has been picked up and shipped out we retain ownership and so it is in our interest to monitor custody. The almonds are delivered to a huller/sheller processor co-op called Central California Almond Growers Association (CCAGA) and then to a handler named Panoche Creek Packing (Panoche Creek) These enterprises are not too distant by truck route but our product undergoes quite the transformation  along the way. A follow up post will describe in detail the operations at these facilities. They can/will provide us a private tour which you would find fascinating but generally what we see from our office chairs are the following steps:

  1. Trucker Ticket Receipt furnished as loads depart the orchard. The truck driver makes a record as his hauling fee is dependent upon the number of loads that are transported. 
  2. Weighmaster Certificate  e.g. 11900040 as each load stops to be weighed. The truck drives onto a full length scale at the weigh station. The known empty weight of the rig is subtracted from the gross to get the almond field weight. 
  3. CCAGA Grower Deliveries a tabulation of all truck loads. Referenced are a Delivery Ticket (No.) and/or a Weight Ticket (No.)
  4. CCAGA Stock Pile Grower History The almonds get deposited on the ground into a numbered pile where they await their turn for hulling and shelling. The Weight Certificate # is logged and correlated to a Delivery Receipt #  e.g. 1935561 and assigned a Stock Pile Number e.g. KNK12
  5. CCAGA Turn Out Details is a recapitulation after the almonds in the field are combined in batch for post harvest processing. The hull is separated leaving the almond shell intact with nut inside if desired. (We receive a small compensation from the hull material which is sold for animal feed and other residual uses.) The In-shell almonds, shelled almonds, and loose meats are allocated to smaller Wood Bins and numbered e.g. Bin # 19901328
  6. CCAGA Shipping Manifest is a list of the Wood Bin(s) by number. Each Bin provides a total net weight and these are sum totaled. Truck transport info is documented as the crop harvest is next to be received by the finish processor facility and marketing agent. A Manifest No. is assigned for the next stage.
  7. Panoche Creek Inedible Almond Inspection Field Notes accompanies the CCAGA Shipping Manifest. It is a randomly drawn test sample taken from the almond kernels in a Bin for the CCAGA Shipping Manifest. The sample is analysed to determine the extent of foreign material, moisture, etc. This testing result is tied to the Panoche Creek Grower Delivery Report outcome which follows.
  8. Panoche Creek Grower Delivery Report is the final document record and it is a tabulation summary from the CCAGA Shipping Manifest. The Net Good Meats are calculated using the associated Almond Inspection Field Note as a global template for that batch. Finally, the tabulation is sub-totaled by variety and by field location in this report.

These documents, in the order listed above, are correlated by at least one serial identifier in turn. For instance,  a Grower Delivery has a Weight Ticket that matches a Weight Cert# on the Stock Pile Grower History. These two forms are linked in this way. The form documents form an event chain through the entire process.

Have a look at this PDF link:  Example Paper Trail for Nonpareil – East Block and see if you can follow the path of Bin (19300338) holding loose nuts  (Note: the example starts with and shows Step 3 through Step 8)

Wood Bins with Almonds transported from the CCAGA Huller facility to Panoche Creek Packing.

Change Tack

What just happened?

Witness case studies of some high profile business failures in recent memory. Sears, Kodak are two examples of companies that once thrived but didn’t adapt.  One could fix blame upon disruptive technologies or market upheaval. Such companies stick with their game plan because either status quo or complacency or denial.  Capital investment in infrastructure can make it difficult to evolve.

Our enterprise is no different and we know that we are at a crossroads. The decision has been made to shift gears.  Whereas previously, we were Almond Orchard and Wine Grape farmers with emphasis on the almond tree side. We will now transition solely to the vineyard business going forward.

Background Note

An orchard has a typical lifespan of 20-25 years. When an orchard is no longer viable it is deleted and re-established. There is a 5 year wait for tree replants to grow from nursery size to the threshold of crop [income] production.  Ours (new in 1998) is soon approaching EOL.

Risk

  1. Almond commodity prices are fairly stable for the moment but are experiencing downward pressure from the endless additions of new acreage year by year.
  2. Irrigation water is about to become much more expensive with government entities seeking to monitor and regulate its usage.
  3. The existing trees are enduring the effects of increasing salts  attributable to the aquifer and our local soil characteristic.
  4. New orchard development costs are immense.

Objective

Strengthen the empire that Estee Strombotne has built during the last several decades and to position ourselves for future greatness. Ready to come about? This new direction will offer challenges and exciting times ahead!

Water Mandate (nitty-gritty)

up close with government acronyms

As previously briefed, we can expect a mandate reducing and ultimately prohibiting overdrafting of our aquifer supply. Legislation was signed into law in 2014 to be overseen by the California Department of Water Resources. Specifically, the Sustainable Groundwater Management Act ( SGMA ) is a compliance framework that delegates responsibility to local level management entities to develop and implement a plan toward that end.

Our farm property lays within the local jurisdiction of the McMullin Area Groundwater Sustainability Agency (MAGSA ) or GSA for short. The GSA is developing and implementing a plan to be approved and tracked by the state and will have the authority to assess fees, adopt rules and conduct enforcement. Our GSA must work collectively with other GSAs under the direction of a Joint Powers Authority GSA (Fresno County and its 2 Water Districts).

Plan development must be complete by year 2020. Coincidentally, our previous ranch manager, Don Cameron, is a director and co-chairman of the Raisin City Water District and thereby one of the five board members of the Joint Powers Authority GSA. He is a prominent voice and is active in the direction of GSA policy as you will note further on.

Responsibility

The MAGSA must determine its over-drafting responsibility for the region. Realize that the aquifer is vast and does not recognize political boundaries.  As you might surmise neighboring GSAs will make a case that “their” groundwater share is flowing into and being used up by ours.  It has been [unofficially] estimated that 125,000 acre feet of groundwater is over-drafted in the MAGSA each year.

This is Us

A solution (?)

A possible plan to achieve sustainability (Don Cameron’s) involves the idea of replenishment through the diversion of flood water flows when they naturally occur. These flows, which would otherwise be lost to the sea, would instead be funneled to select crop land holding areas within the GSA. Over time the standing water would join the aquifer through gravitational percolation or perhaps more quickly by way of dry wells — a reverse pumping concept or groundwater recharge. Funding for recharge study and actual testing have been conducted by Don Cameron as proof of concept. Phase I of his McMullin On-Farm Recharge Project on Terranova Ranch, Inc land holdings will be completed by the end of this year at a cost of $12 million in federal funding. Don Cameron holds title of Vice President and General Manager at Terranova. Phase I of the project is limited and specific to Terranova. It is not certain that there will be a Phase II or that our location in proximity might be included.

Outcomes

A recent idea, the concept of selling or transferring groundwater rights, is  gaining traction. Renewable Energy Credits (REC) have established a precedent which may be applied to irrigation supply. In theory, a farmer who fallows his field and discontinues pumping could sell his share credit as if it were a commodity. A buyer would use his purchase to offset or reduce penalties for what would otherwise be considered an overage.  In another example, Terranova might do the same by justifying that their recharge system experiment puts back more than they take out. They enjoy sustainability while marketing the excess credit.

We are hopeful that solutions and agreements can be achieved. Last year we used 993.4 acre feet of water. A scenario might have us reducing pumping by “x” percent in order to do our part. Agony would be GSA failure to meet SGMA established timeline goals and the state assuming restrictive control compounded with significant flowage derived monetary penalties/fees.

Extra credit for enduring the following PowerPoint Presentation:

Anticipating the Future

Some Clouds on Horizon

Our California farmland is an ideal environment for the crops that we grow with many sunshine filled days and until recently abundant water supply. California has been experiencing a protracted drought which we acknowledge as lengthy and significant. According to recorded statistics most droughts last only for a season or two or three. The previous record was way back in the dirty thirties . The current 2006-2017 drought has eclipsed this infamous Dust Bowl event by 3 years in length and counting.

Supply

  1. Natural rainfall, which occurs strictly during winter months and is of limited supply for sustaining annual range grass and desert shrub. It is not relied upon in our arid valley and must be augmented by irrigation.
  2. Managed resources imported from mountainous flows primarily to our North and East. This supply travels via canal and aqueduct, is subsidized and controlled by public government. It is used for flood control and is doled out to farmers and urban communities on an as needed basis. Cost effective but limited in scope.
  3. Natural aquifer aka ground water or the water table. This is our relied upon and only source option. Expensive but readily available.

…and Demand

These drought years coupled with growing needs have placed strain on the availability of surface water. With scarcity comes limits and many of those farmers who enjoyed the good fortune of cheap water in the past have been forced to drill wells for supplement as a matter of necessity.  This in turn has placed an unprecedented  burden on the aquifer.  Whereas, the water table had been reliably stable over time we are witnessing a certain fragility. The acceleration of diminishing water quantity and water quality degradation in terms of mineral content is cause for alarm.  Also, as an extreme, sea water ingress and land subsidence.

Reaction

Alarm bells have captured the attention of environmentalists, media, and regulators scrutinizing where water goes, who is to blame, and corrective ideas. Politics and economics are a complicated tangle but for sure, changes are afoot. In the short term we expect to see usage monitoring on a granular individual farm basis  e.g. registering number of wells and reporting of outputs. In the future, regulatory restrictions and [reduced] usage mandates.

On a routine basis we monitor our local water table for fluctuation, measure outflow usage, and sample water quality so we are well aware of these issues first hand.

So, while we are seeing darkening clouds on the horizon we are hoping that they will result in much needed rain. Our response must be to comply with the mandates and adapting as necessary to remain viable.

Well No. 1 – 100 HP as new installation – 1962